Long
Sibanye
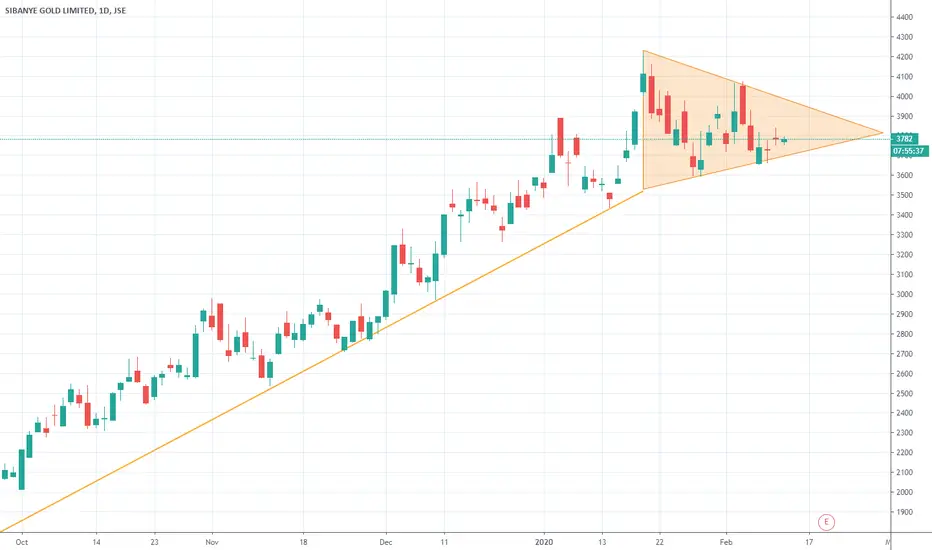
The share price of Sibanye has moved into a triangle shaped consolidation. The consolidation follows the strong uptrend we have seen on the stock. The triangle consolidation alludes to a short pause in the trend before this trend is continued. A close above resistance at 4040 would consider an upside breakout, confirming the pattern and continuation of the uptrend. In this scenario, traders might look for a move higher proportionate to the height of the triangle pattern. A close below the lower level of triangle support would suggest the failure of the move.
A close below the 3650 level would instead consider a downside breakout, suggesting a reversal of the preceding uptrend. As triangles are more commonly thought to be continuation patterns, a downside breakout would not be considered a favourable trading scenario (unlike the upside breakout scenario highlighted above).
A close below the 3650 level would instead consider a downside breakout, suggesting a reversal of the preceding uptrend. As triangles are more commonly thought to be continuation patterns, a downside breakout would not be considered a favourable trading scenario (unlike the upside breakout scenario highlighted above).
ปิดการเทรด: ถึงเป้าหมายการทำกำไร

คำจำกัดสิทธิ์ความรับผิดชอบ
ข้อมูลและบทความไม่ได้มีวัตถุประสงค์เพื่อก่อให้เกิดกิจกรรมทางการเงิน, การลงทุน, การซื้อขาย, ข้อเสนอแนะ หรือคำแนะนำประเภทอื่น ๆ ที่ให้หรือรับรองโดย TradingView อ่านเพิ่มเติมใน ข้อกำหนดการใช้งาน
คำจำกัดสิทธิ์ความรับผิดชอบ
ข้อมูลและบทความไม่ได้มีวัตถุประสงค์เพื่อก่อให้เกิดกิจกรรมทางการเงิน, การลงทุน, การซื้อขาย, ข้อเสนอแนะ หรือคำแนะนำประเภทอื่น ๆ ที่ให้หรือรับรองโดย TradingView อ่านเพิ่มเติมใน ข้อกำหนดการใช้งาน