การศึกษา
Status "V Bottom" Pattern | Signal Explained
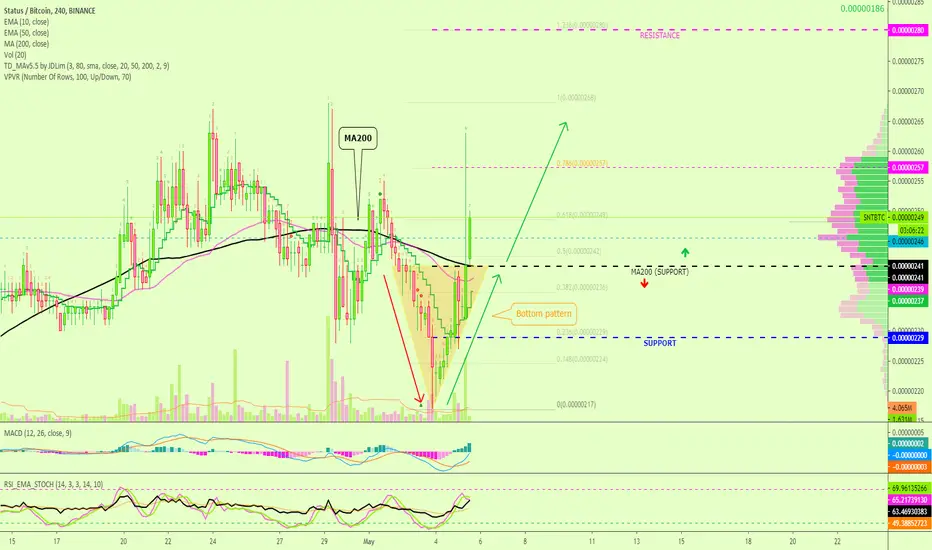
Here we have a "V Bottom" pattern for Status (SNTBTC), this can signal that a low is in and prices can resume or reverse up.
Here you can see prices breaking below MA200 (black line) to form the v bottom, and later moving back above this level.
I also marked the main strong support and resistance levels.
Feel free to hit LIKE for more.
Namaste.
Here you can see prices breaking below MA200 (black line) to form the v bottom, and later moving back above this level.
I also marked the main strong support and resistance levels.
Feel free to hit LIKE for more.
Namaste.
ปิดการเทรด: ถึงเป้าหมายการทำกำไร
& Going higher.
💯 TOP Results (Sept 2026) 👇
t.me/masteranandatrades/9279
🔥 10-25X Leverage, Results & Profits
t.me/masteranandatrades/9271
✅ 4 PREMIUM Telegram channels special offer
—One-Time Payment! (🔝 since 2017)
t.me/lamatrades/4
t.me/masteranandatrades/9279
🔥 10-25X Leverage, Results & Profits
t.me/masteranandatrades/9271
✅ 4 PREMIUM Telegram channels special offer
—One-Time Payment! (🔝 since 2017)
t.me/lamatrades/4
การนำเสนอที่เกี่ยวข้อง
คำจำกัดสิทธิ์ความรับผิดชอบ
ข้อมูลและบทความไม่ได้มีวัตถุประสงค์เพื่อก่อให้เกิดกิจกรรมทางการเงิน, การลงทุน, การซื้อขาย, ข้อเสนอแนะ หรือคำแนะนำประเภทอื่น ๆ ที่ให้หรือรับรองโดย TradingView อ่านเพิ่มเติมใน ข้อกำหนดการใช้งาน
💯 TOP Results (Sept 2026) 👇
t.me/masteranandatrades/9279
🔥 10-25X Leverage, Results & Profits
t.me/masteranandatrades/9271
✅ 4 PREMIUM Telegram channels special offer
—One-Time Payment! (🔝 since 2017)
t.me/lamatrades/4
t.me/masteranandatrades/9279
🔥 10-25X Leverage, Results & Profits
t.me/masteranandatrades/9271
✅ 4 PREMIUM Telegram channels special offer
—One-Time Payment! (🔝 since 2017)
t.me/lamatrades/4
การนำเสนอที่เกี่ยวข้อง
คำจำกัดสิทธิ์ความรับผิดชอบ
ข้อมูลและบทความไม่ได้มีวัตถุประสงค์เพื่อก่อให้เกิดกิจกรรมทางการเงิน, การลงทุน, การซื้อขาย, ข้อเสนอแนะ หรือคำแนะนำประเภทอื่น ๆ ที่ให้หรือรับรองโดย TradingView อ่านเพิ่มเติมใน ข้อกำหนดการใช้งาน