
Ho, this baby ar screaming to be shortened! :D
Take a look at W, H1 and yes D chart here.
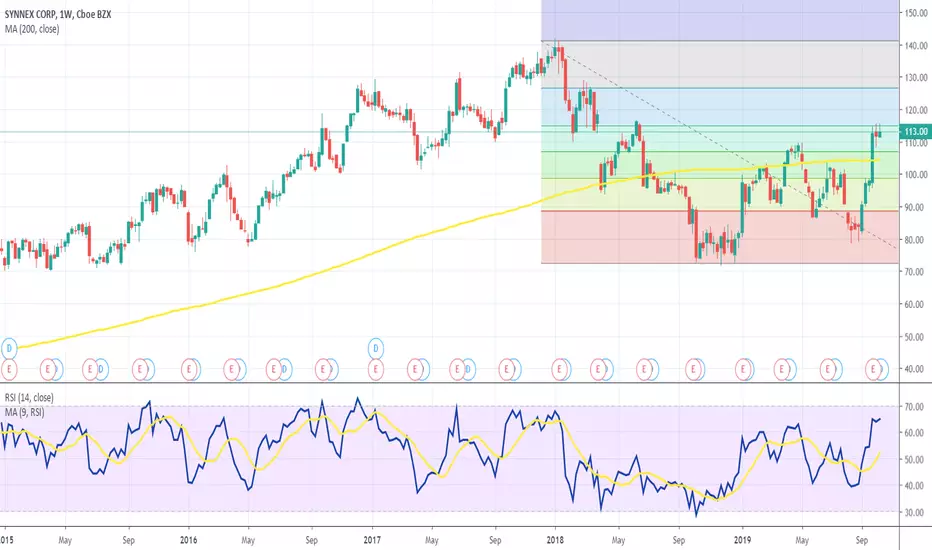
RSI is highly overbought, and value is floating in that area for some time, which is one of the clearest signals of possible price movement change.
Fibonacci on W time frame, 61.8 is to strong resistance level, for now.
My play is sell short with R/R 2:7
Take a look at W, H1 and yes D chart here.
RSI is highly overbought, and value is floating in that area for some time, which is one of the clearest signals of possible price movement change.
Fibonacci on W time frame, 61.8 is to strong resistance level, for now.
My play is sell short with R/R 2:7

คำจำกัดสิทธิ์ความรับผิดชอบ
ข้อมูลและบทความไม่ได้มีวัตถุประสงค์เพื่อก่อให้เกิดกิจกรรมทางการเงิน, การลงทุน, การซื้อขาย, ข้อเสนอแนะ หรือคำแนะนำประเภทอื่น ๆ ที่ให้หรือรับรองโดย TradingView อ่านเพิ่มเติมใน ข้อกำหนดการใช้งาน
คำจำกัดสิทธิ์ความรับผิดชอบ
ข้อมูลและบทความไม่ได้มีวัตถุประสงค์เพื่อก่อให้เกิดกิจกรรมทางการเงิน, การลงทุน, การซื้อขาย, ข้อเสนอแนะ หรือคำแนะนำประเภทอื่น ๆ ที่ให้หรือรับรองโดย TradingView อ่านเพิ่มเติมใน ข้อกำหนดการใช้งาน