
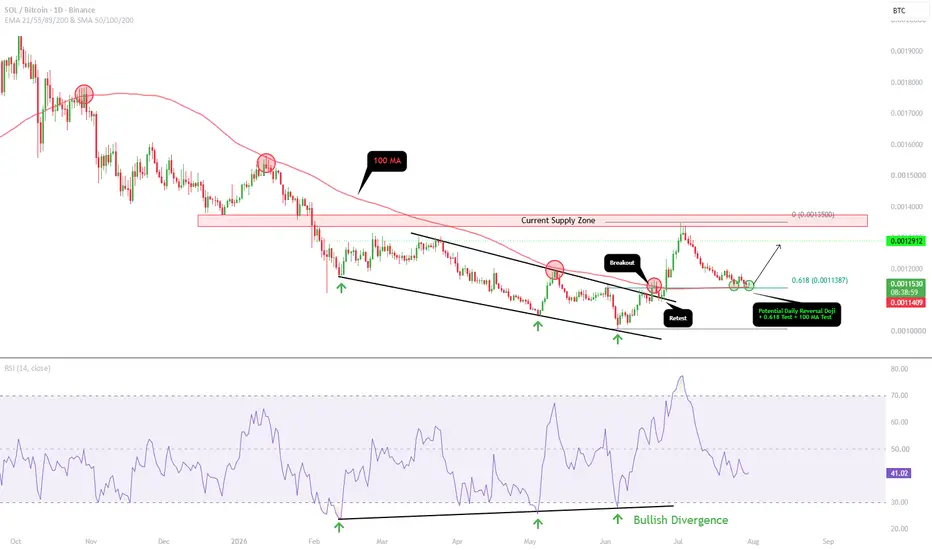
Right now SOL, in relation to BTC, is looking to form a significant low. If successful, that would mean SOL should begin gaining value against Bitcoin.
To understand this fully, we must first examine what has happened since the bull market top.
The Daily 100 MA
The first point of focus is the 100 moving average on the daily timeframe (red MA). This is where the SOL/BTC top formed at the end of October 2025 (red circle). It then marked the top again in January 2026, once more in May 2026, and again with the daily candle bodies in June 2026.
Now SOL/BTC is once again testing this same key moving average, but this time price is using it as a level of demand rather than supply (green circles). The first test occurred on July 24th, and then yesterday and today (July 29th and 30th), SOL/BTC saw two clean liquidity tests of this level with wicks triggering algo buy orders. For this pair, accumulation shows up as BTC being converted into SOL, which increases SOL's ratio against BTC.
The Downward Channel
The next structure worth outlining is the downward channel (black trendlines) that formed over four months, from February 2026 to the low established in June.
This channel marked many tops to the upside and many lows to the downside. Let's look at the lows first. In February 2026 price saw a low followed by two lower lows (green arrows). At the same time, the RSI saw a low followed by two higher lows (green arrows), forming a clear bullish divergence on the daily timeframe. Shortly after that divergence was established, SOL increased 35% relative to BTC.
Looking at the upper black trendline near the end of June, SOL/BTC saw a breakout and successful retest of the trendline, giving the ratio the strength to begin its massive 23% increase from that retest alone. This is structurally significant for the future of this trend.
The Psychological Level
One final structural note is that the ratio bottomed extremely close to 0.001. That means 1 SOL would be equivalent to 0.001 BTC, or in other words, 1,000 SOL = 1 BTC, an extremely important psychological level for SOL/BTC's macro structure.
The 0.618 Fibonacci Confluence
The final piece worth outlining is that this significant low is also forming right at the 0.618 retracement of SOL/BTC's current trend.
Looking at the move from the low on June 6, 2026 to the high on July 2, 2026, the 0.618 golden retracement level sits at almost the exact same price as the 100 MA and the wick lows established over the past two days. This is nothing to ignore and adds further weight to the theory that SOL is about to begin outperforming Bitcoin, even if only in the short term.
Upside Targets
Right now the upside targets for where this move could reach are the dotted green ray around 0.00129, and the current supply zone (red box) sitting between 0.00133 and 0.00138.

คำจำกัดสิทธิ์ความรับผิดชอบ
ข้อมูลและบทความไม่ได้มีวัตถุประสงค์เพื่อก่อให้เกิดกิจกรรมทางการเงิน, การลงทุน, การซื้อขาย, ข้อเสนอแนะ หรือคำแนะนำประเภทอื่น ๆ ที่ให้หรือรับรองโดย TradingView อ่านเพิ่มเติมใน ข้อกำหนดการใช้งาน
คำจำกัดสิทธิ์ความรับผิดชอบ
ข้อมูลและบทความไม่ได้มีวัตถุประสงค์เพื่อก่อให้เกิดกิจกรรมทางการเงิน, การลงทุน, การซื้อขาย, ข้อเสนอแนะ หรือคำแนะนำประเภทอื่น ๆ ที่ให้หรือรับรองโดย TradingView อ่านเพิ่มเติมใน ข้อกำหนดการใช้งาน