
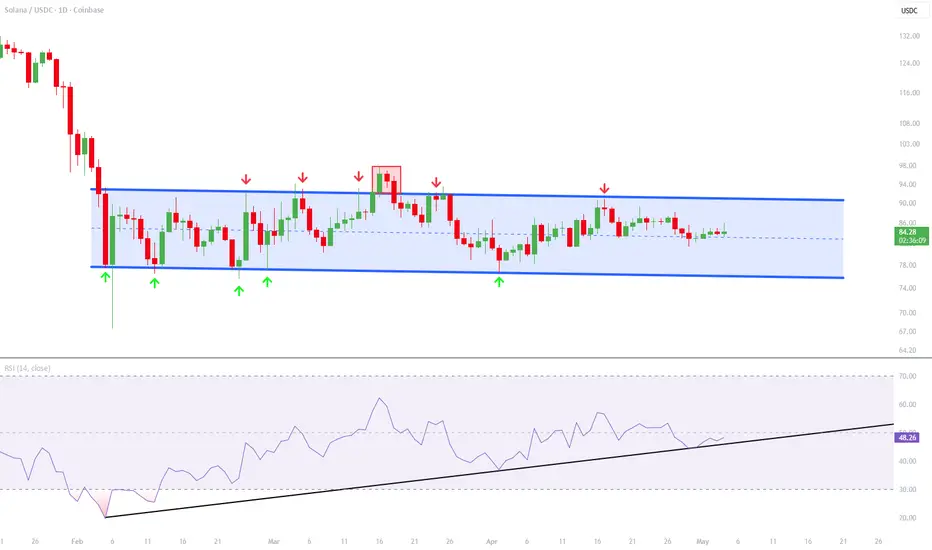
With the recent price action, Solana has remained highly correlated between the lows and highs of its channel, creating a very strong parallel structure.
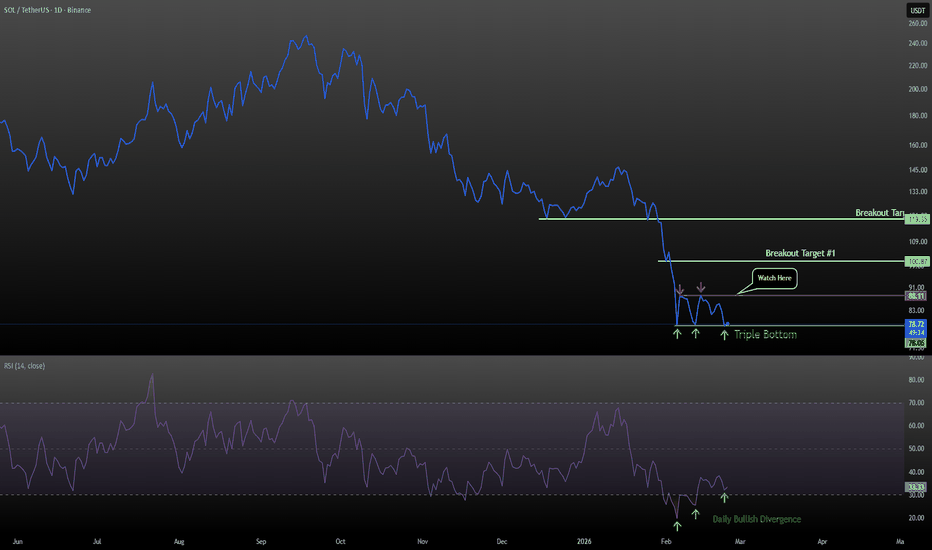
The lows are around $76 with the primary daily candle body closes sitting around $78. This can be clearly seen on the daily line chart I posted a while ago. Even the most recent low on April 1st held that solid green trendline on the line chart:
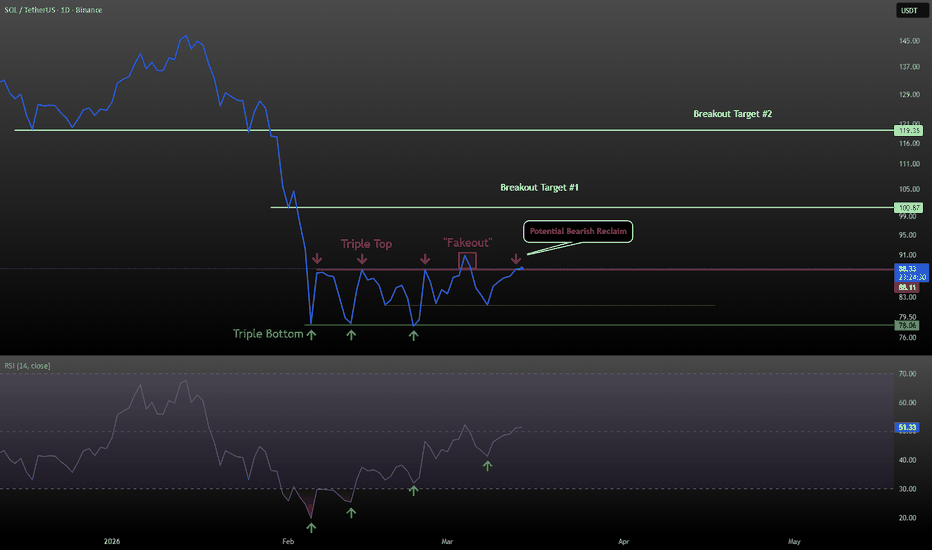
The upper range is a little harder to identify precisely, but the main highs have been established around $91 to $92 with the key daily candle closes primarily coming in around $88. This can be seen to a certain extent on the line chart outlined here:
The lows are around $76 with the primary daily candle body closes sitting around $78. This can be clearly seen on the daily line chart I posted a while ago. Even the most recent low on April 1st held that solid green trendline on the line chart:
The upper range is a little harder to identify precisely, but the main highs have been established around $91 to $92 with the key daily candle closes primarily coming in around $88. This can be seen to a certain extent on the line chart outlined here:

คำจำกัดสิทธิ์ความรับผิดชอบ
ข้อมูลและบทความไม่ได้มีวัตถุประสงค์เพื่อก่อให้เกิดกิจกรรมทางการเงิน, การลงทุน, การซื้อขาย, ข้อเสนอแนะ หรือคำแนะนำประเภทอื่น ๆ ที่ให้หรือรับรองโดย TradingView อ่านเพิ่มเติมใน ข้อกำหนดการใช้งาน
คำจำกัดสิทธิ์ความรับผิดชอบ
ข้อมูลและบทความไม่ได้มีวัตถุประสงค์เพื่อก่อให้เกิดกิจกรรมทางการเงิน, การลงทุน, การซื้อขาย, ข้อเสนอแนะ หรือคำแนะนำประเภทอื่น ๆ ที่ให้หรือรับรองโดย TradingView อ่านเพิ่มเติมใน ข้อกำหนดการใช้งาน