
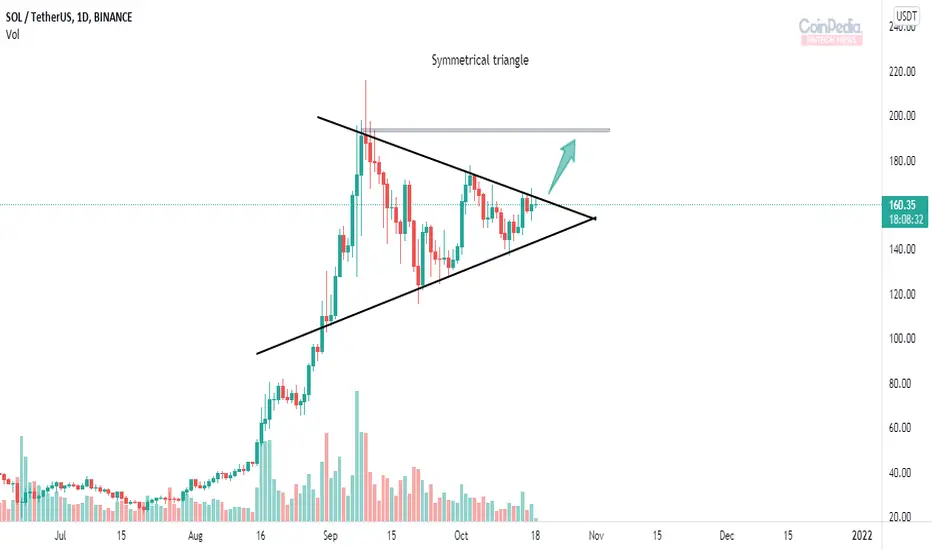
* Solana in 1D time frame forms a Symmetrical triangle
* Symmetrical triangle appears when the price consolidates between two trend-lines slightly sloping towards each other.
* Here the below Ascending trendline works as support for the price and the above Descending trendline as resistance
* If SOL breaks the above trendline we can see continuation of the trend.
* Symmetrical triangle appears when the price consolidates between two trend-lines slightly sloping towards each other.
* Here the below Ascending trendline works as support for the price and the above Descending trendline as resistance
* If SOL breaks the above trendline we can see continuation of the trend.
ปิดการเทรด: ถึงเป้าหมายการทำกำไร

คำจำกัดสิทธิ์ความรับผิดชอบ
ข้อมูลและบทความไม่ได้มีวัตถุประสงค์เพื่อก่อให้เกิดกิจกรรมทางการเงิน, การลงทุน, การซื้อขาย, ข้อเสนอแนะ หรือคำแนะนำประเภทอื่น ๆ ที่ให้หรือรับรองโดย TradingView อ่านเพิ่มเติมใน ข้อกำหนดการใช้งาน
คำจำกัดสิทธิ์ความรับผิดชอบ
ข้อมูลและบทความไม่ได้มีวัตถุประสงค์เพื่อก่อให้เกิดกิจกรรมทางการเงิน, การลงทุน, การซื้อขาย, ข้อเสนอแนะ หรือคำแนะนำประเภทอื่น ๆ ที่ให้หรือรับรองโดย TradingView อ่านเพิ่มเติมใน ข้อกำหนดการใช้งาน