
📊 Technical Analysis
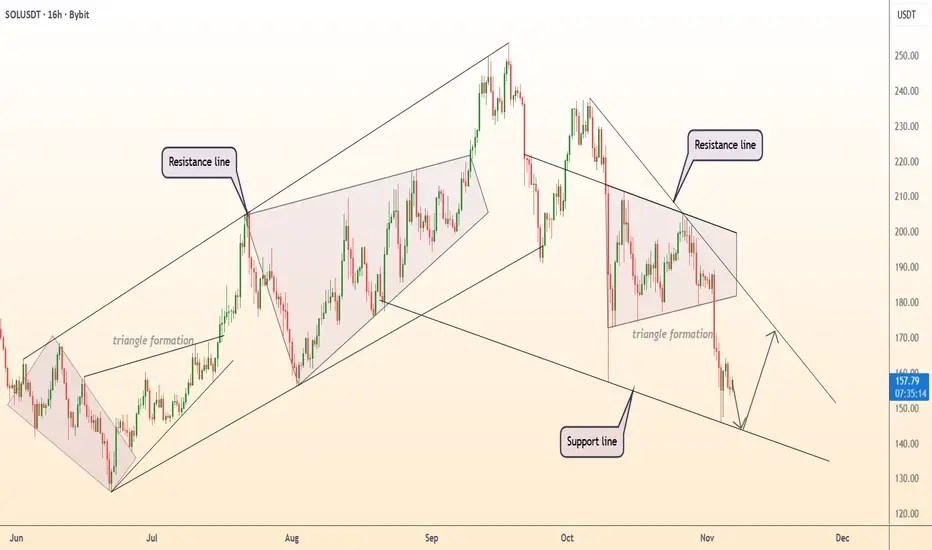
● SOL/USD is testing the lower boundary of the descending channel near $150, a key support aligning with the broader bullish trendline from June. The pattern suggests a potential rebound within the channel toward $175–$180 resistance.
● Multiple triangle formations indicate prior consolidation phases before upward moves, reinforcing the likelihood of another medium-term recovery if support holds.
💡 Fundamental Analysis
● Growing institutional activity in Solana’s DeFi and NFT ecosystems continues to support long-term investor confidence, despite short-term volatility.
✨ Summary
● Support: $150. Resistance: $175–$180. A sustained bounce from the lower trendline could trigger a rally toward $190.
-------------------
Share your opinion in the comments and support the idea with a like. Thanks for your support!
● SOL/USD is testing the lower boundary of the descending channel near $150, a key support aligning with the broader bullish trendline from June. The pattern suggests a potential rebound within the channel toward $175–$180 resistance.
● Multiple triangle formations indicate prior consolidation phases before upward moves, reinforcing the likelihood of another medium-term recovery if support holds.
💡 Fundamental Analysis
● Growing institutional activity in Solana’s DeFi and NFT ecosystems continues to support long-term investor confidence, despite short-term volatility.
✨ Summary
● Support: $150. Resistance: $175–$180. A sustained bounce from the lower trendline could trigger a rally toward $190.
-------------------
Share your opinion in the comments and support the idea with a like. Thanks for your support!

การนำเสนอที่เกี่ยวข้อง
คำจำกัดสิทธิ์ความรับผิดชอบ
ข้อมูลและบทความไม่ได้มีวัตถุประสงค์เพื่อก่อให้เกิดกิจกรรมทางการเงิน, การลงทุน, การซื้อขาย, ข้อเสนอแนะ หรือคำแนะนำประเภทอื่น ๆ ที่ให้หรือรับรองโดย TradingView อ่านเพิ่มเติมใน ข้อกำหนดการใช้งาน
การนำเสนอที่เกี่ยวข้อง
คำจำกัดสิทธิ์ความรับผิดชอบ
ข้อมูลและบทความไม่ได้มีวัตถุประสงค์เพื่อก่อให้เกิดกิจกรรมทางการเงิน, การลงทุน, การซื้อขาย, ข้อเสนอแนะ หรือคำแนะนำประเภทอื่น ๆ ที่ให้หรือรับรองโดย TradingView อ่านเพิ่มเติมใน ข้อกำหนดการใช้งาน