
🔎 Technical Outlook
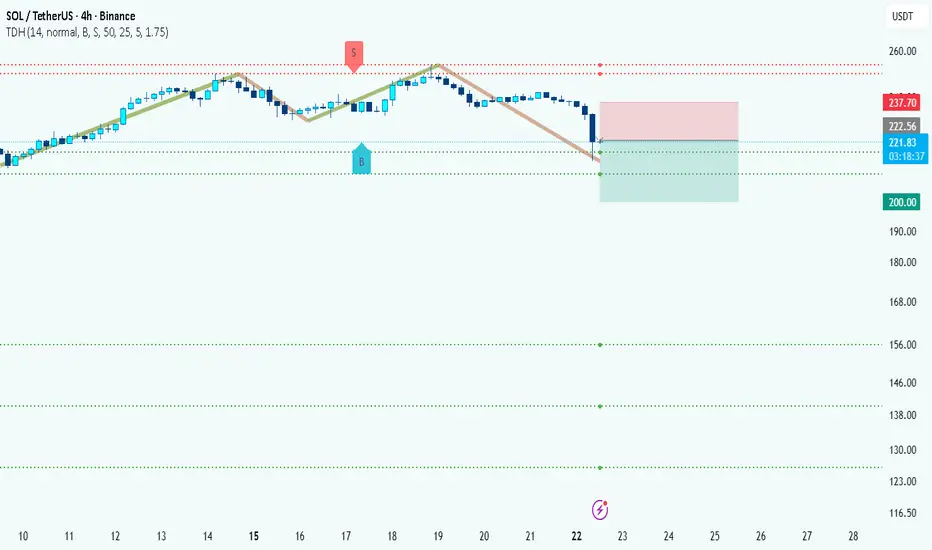
• Trend: After a strong rally toward $250, Solana has started forming lower highs and lower lows, a clear sign of weakening momentum.
• Resistance Zone: Price faced rejection near $237 – $240, which aligns with a previous supply zone. This has turned into a ceiling for the market.
• Support Levels: Current price is hovering around $222, but if sellers maintain control, the next strong demand zone lies near $200 — also your marked target.
• Candlestick Behavior: The recent sharp decline shows strong bearish pressure, and recovery attempts have been weak, signaling more downside potential.
________________________________________
📉 Trade Setup (Bearish)
• Entry Zone: $222 – $223 (current area)
• Stop-Loss: $238 (above resistance and last swing high)
• Take Profit 1: $210 (interim support)
• Take Profit 2: $200 (major support)
• Risk/Reward: ~1:2 (attractive setup)
________________________________________
🛡 Risk Management
• 📉 Partial Profits: Secure partial gains at $210 before targeting $200.
• 🔒 Trailing Stop: Once $210 is hit, move SL to breakeven ($222) and trail down to lock profits.
• 🚫 Invalidation: A sustained break above $240 would cancel the bearish outlook and could push SOL back to $250+.
________________________________________
✅ Summary
Solana looks weak after repeated rejections at $237 – $240, and bears are in control. If sellers maintain momentum, a drop toward $210 and $200 is likely. The setup favors shorting rallies with a tight stop-loss above resistance.
________________________________________
• Trend: After a strong rally toward $250, Solana has started forming lower highs and lower lows, a clear sign of weakening momentum.
• Resistance Zone: Price faced rejection near $237 – $240, which aligns with a previous supply zone. This has turned into a ceiling for the market.
• Support Levels: Current price is hovering around $222, but if sellers maintain control, the next strong demand zone lies near $200 — also your marked target.
• Candlestick Behavior: The recent sharp decline shows strong bearish pressure, and recovery attempts have been weak, signaling more downside potential.
________________________________________
📉 Trade Setup (Bearish)
• Entry Zone: $222 – $223 (current area)
• Stop-Loss: $238 (above resistance and last swing high)
• Take Profit 1: $210 (interim support)
• Take Profit 2: $200 (major support)
• Risk/Reward: ~1:2 (attractive setup)
________________________________________
🛡 Risk Management
• 📉 Partial Profits: Secure partial gains at $210 before targeting $200.
• 🔒 Trailing Stop: Once $210 is hit, move SL to breakeven ($222) and trail down to lock profits.
• 🚫 Invalidation: A sustained break above $240 would cancel the bearish outlook and could push SOL back to $250+.
________________________________________
✅ Summary
Solana looks weak after repeated rejections at $237 – $240, and bears are in control. If sellers maintain momentum, a drop toward $210 and $200 is likely. The setup favors shorting rallies with a tight stop-loss above resistance.
________________________________________
การซื้อขายยังคงดำเนินอยู่
Start Booking Profits and Move You SL to Breakeven
การนำเสนอที่เกี่ยวข้อง
คำจำกัดสิทธิ์ความรับผิดชอบ
ข้อมูลและบทความไม่ได้มีวัตถุประสงค์เพื่อก่อให้เกิดกิจกรรมทางการเงิน, การลงทุน, การซื้อขาย, ข้อเสนอแนะ หรือคำแนะนำประเภทอื่น ๆ ที่ให้หรือรับรองโดย TradingView อ่านเพิ่มเติมใน ข้อกำหนดการใช้งาน
การนำเสนอที่เกี่ยวข้อง
คำจำกัดสิทธิ์ความรับผิดชอบ
ข้อมูลและบทความไม่ได้มีวัตถุประสงค์เพื่อก่อให้เกิดกิจกรรมทางการเงิน, การลงทุน, การซื้อขาย, ข้อเสนอแนะ หรือคำแนะนำประเภทอื่น ๆ ที่ให้หรือรับรองโดย TradingView อ่านเพิ่มเติมใน ข้อกำหนดการใช้งาน