
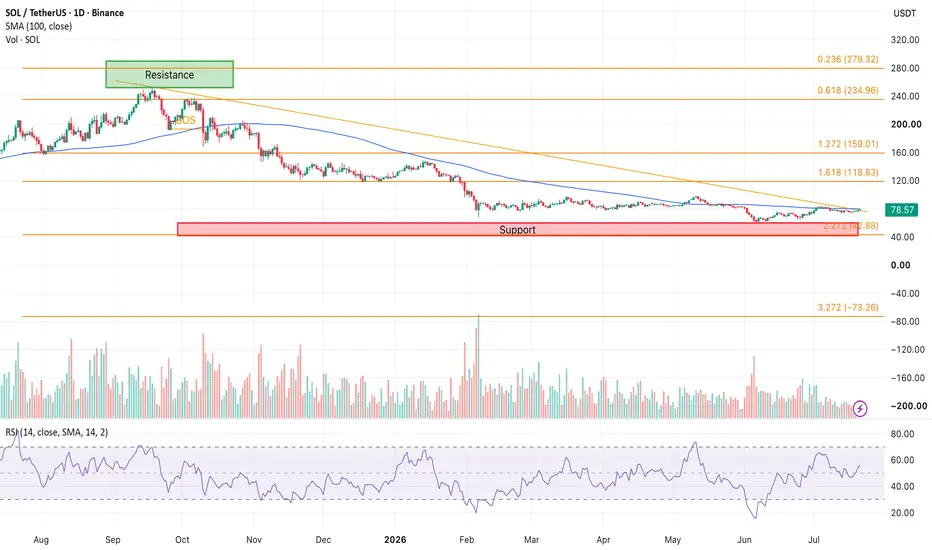
* The SOL price remains below key moving averages, with resistance at $79.84 and $85.
* Solana continues recording 4–6.4 million daily active addresses and up to 56 million daily transfers.
* SBI Holdings plans a 3% yield yen-backed stablecoin platform on Solana, boosting the network's institutional adoption.
Solana is approaching a level that could determine its next major move. After dropping more than 72% from its late-2025 peak, the SOL price has settled around the $76 mark, where buyers are trying to stop the downtrend from extending further.
One analyst believes this area could become an important turning point. Gum points out that the SOL price moved from roughly $75 to $140 with very little resistance during the previous bull market.
The correction erased those gains just as quickly, leaving behind what traders call an imbalance. If buyers can eventually reclaim $125, he believes there is relatively little resistance before the yearly open near $143.
We had a look at the SOL charts, and there are a few encouraging signs. The SOL price is trading just 2.1% below the 4-hour 100-period moving average at $77.94, and the 4-hour RSI has climbed to 53.75.
On the daily chart, RSI has recovered to 50.16 and continues making higher lows even though the SOL price printed lower lows during the correction. That type of divergence often appears when bearish momentum starts losing strength.
Beyond the charts, Solana's network remains extremely active. Daily active addresses continue ranging between 4 million and 6.4 million, with the blockchain processing as many as 56 million transfers per day.
For now, buyers need to reclaim the resistance levels at $77.94 and $79.84 before attention can turn to $85. Beyond that, the bigger test remains the $110 to $125 region. If support fails instead, the next levels to watch are $75.64, $70, and then $60. Meanwhile, CoinCodex's one-month forecast places the SOL price at $102.49, pointing to further upside if buyers can reclaim those key resistance levels.
* Solana continues recording 4–6.4 million daily active addresses and up to 56 million daily transfers.
* SBI Holdings plans a 3% yield yen-backed stablecoin platform on Solana, boosting the network's institutional adoption.
Solana is approaching a level that could determine its next major move. After dropping more than 72% from its late-2025 peak, the SOL price has settled around the $76 mark, where buyers are trying to stop the downtrend from extending further.
One analyst believes this area could become an important turning point. Gum points out that the SOL price moved from roughly $75 to $140 with very little resistance during the previous bull market.
The correction erased those gains just as quickly, leaving behind what traders call an imbalance. If buyers can eventually reclaim $125, he believes there is relatively little resistance before the yearly open near $143.
We had a look at the SOL charts, and there are a few encouraging signs. The SOL price is trading just 2.1% below the 4-hour 100-period moving average at $77.94, and the 4-hour RSI has climbed to 53.75.
On the daily chart, RSI has recovered to 50.16 and continues making higher lows even though the SOL price printed lower lows during the correction. That type of divergence often appears when bearish momentum starts losing strength.
Beyond the charts, Solana's network remains extremely active. Daily active addresses continue ranging between 4 million and 6.4 million, with the blockchain processing as many as 56 million transfers per day.
For now, buyers need to reclaim the resistance levels at $77.94 and $79.84 before attention can turn to $85. Beyond that, the bigger test remains the $110 to $125 region. If support fails instead, the next levels to watch are $75.64, $70, and then $60. Meanwhile, CoinCodex's one-month forecast places the SOL price at $102.49, pointing to further upside if buyers can reclaim those key resistance levels.

การนำเสนอที่เกี่ยวข้อง
คำจำกัดสิทธิ์ความรับผิดชอบ
ข้อมูลและบทความไม่ได้มีวัตถุประสงค์เพื่อก่อให้เกิดกิจกรรมทางการเงิน, การลงทุน, การซื้อขาย, ข้อเสนอแนะ หรือคำแนะนำประเภทอื่น ๆ ที่ให้หรือรับรองโดย TradingView อ่านเพิ่มเติมใน ข้อกำหนดการใช้งาน
การนำเสนอที่เกี่ยวข้อง
คำจำกัดสิทธิ์ความรับผิดชอบ
ข้อมูลและบทความไม่ได้มีวัตถุประสงค์เพื่อก่อให้เกิดกิจกรรมทางการเงิน, การลงทุน, การซื้อขาย, ข้อเสนอแนะ หรือคำแนะนำประเภทอื่น ๆ ที่ให้หรือรับรองโดย TradingView อ่านเพิ่มเติมใน ข้อกำหนดการใช้งาน