
Technical Analysis and Outlook:
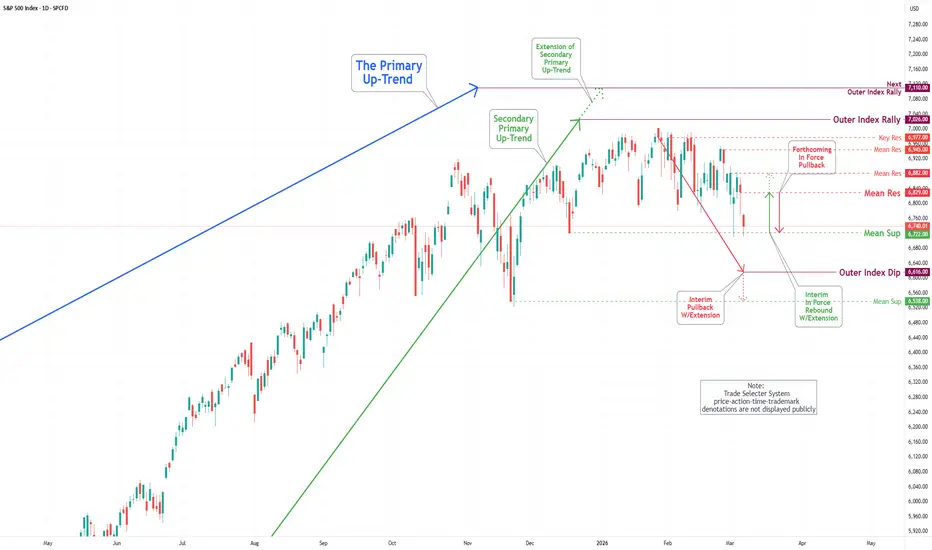
The S&P 500 Index experienced a substantial decline this week, decreasing from the inverse Mean Support level of 6,877 to the Mean Support level of 6,722.
In the forthcoming trading session, the S&P 500 Index is expected to demonstrate a recovery by retesting the Mean Resistance level of 6,829 and possibly extending to the subsequent Mean Resistance level of 6,882.
Nonetheless, one of these levels indicates a significant likelihood of a gradual and steady-to-lower decline toward the Mean Support at 6,722, which may ultimately lead to the completion of the Outer Index Dip at 6,616.
The S&P 500 Index experienced a substantial decline this week, decreasing from the inverse Mean Support level of 6,877 to the Mean Support level of 6,722.
In the forthcoming trading session, the S&P 500 Index is expected to demonstrate a recovery by retesting the Mean Resistance level of 6,829 and possibly extending to the subsequent Mean Resistance level of 6,882.
Nonetheless, one of these levels indicates a significant likelihood of a gradual and steady-to-lower decline toward the Mean Support at 6,722, which may ultimately lead to the completion of the Outer Index Dip at 6,616.

การนำเสนอที่เกี่ยวข้อง
คำจำกัดสิทธิ์ความรับผิดชอบ
ข้อมูลและบทความไม่ได้มีวัตถุประสงค์เพื่อก่อให้เกิดกิจกรรมทางการเงิน, การลงทุน, การซื้อขาย, ข้อเสนอแนะ หรือคำแนะนำประเภทอื่น ๆ ที่ให้หรือรับรองโดย TradingView อ่านเพิ่มเติมใน ข้อกำหนดการใช้งาน
การนำเสนอที่เกี่ยวข้อง
คำจำกัดสิทธิ์ความรับผิดชอบ
ข้อมูลและบทความไม่ได้มีวัตถุประสงค์เพื่อก่อให้เกิดกิจกรรมทางการเงิน, การลงทุน, การซื้อขาย, ข้อเสนอแนะ หรือคำแนะนำประเภทอื่น ๆ ที่ให้หรือรับรองโดย TradingView อ่านเพิ่มเติมใน ข้อกำหนดการใช้งาน