
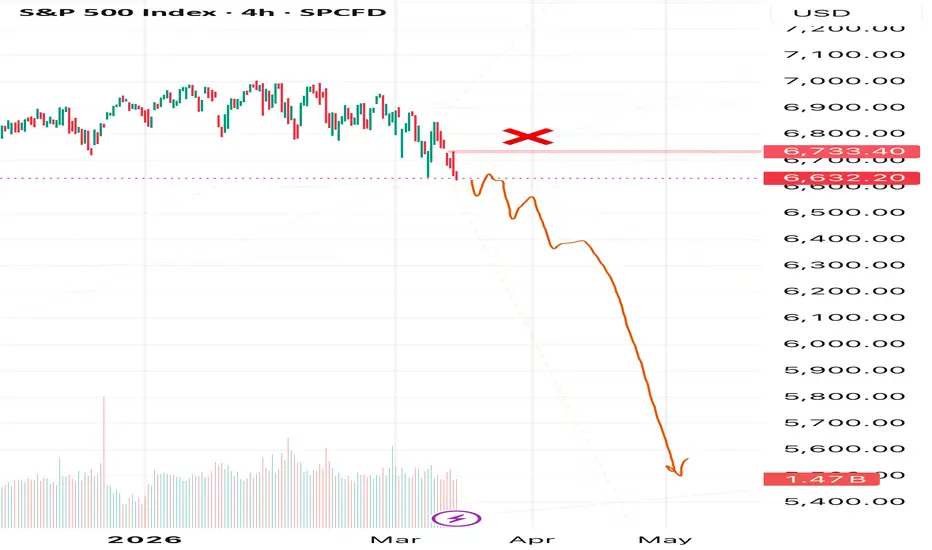
In my view, the S&P 500 may finally be showing signs of a major reversal.
I mentioned this scenario last year, expecting a deep correction rather than endless upside.
Now the price structure is starting to reflect that possibility.
⚠️ What stands out on the chart:
• Momentum fading after a prolonged rally
• Signs of distribution on higher timeframes
• Volatility increasing near the highs
If this scenario continues to unfold, these are the main downside levels I’m watching:
🎯 Target 1: 6400
🎯 Target 2: 6000
🎯 Target 3: 5400
🚫 Invalidation Level: 6734
A sustained move above this level would weaken the bearish scenario.
📊 For now, my macro bias remains bearish until price proves otherwise.
This is just my personal market view and scenario analysis — not financial advice.
Do you see this as the start of a deeper correction, or just another dip to buy? 🤔
Share your thoughts in the comments💭
🔔 Follow to stay updated — I’ll post updates if the scenario develops.
I mentioned this scenario last year, expecting a deep correction rather than endless upside.
Now the price structure is starting to reflect that possibility.
⚠️ What stands out on the chart:
• Momentum fading after a prolonged rally
• Signs of distribution on higher timeframes
• Volatility increasing near the highs
If this scenario continues to unfold, these are the main downside levels I’m watching:
🎯 Target 1: 6400
🎯 Target 2: 6000
🎯 Target 3: 5400
🚫 Invalidation Level: 6734
A sustained move above this level would weaken the bearish scenario.
📊 For now, my macro bias remains bearish until price proves otherwise.
This is just my personal market view and scenario analysis — not financial advice.
Do you see this as the start of a deeper correction, or just another dip to buy? 🤔
Share your thoughts in the comments💭
🔔 Follow to stay updated — I’ll post updates if the scenario develops.

การนำเสนอที่เกี่ยวข้อง
คำจำกัดสิทธิ์ความรับผิดชอบ
ข้อมูลและบทความไม่ได้มีวัตถุประสงค์เพื่อก่อให้เกิดกิจกรรมทางการเงิน, การลงทุน, การซื้อขาย, ข้อเสนอแนะ หรือคำแนะนำประเภทอื่น ๆ ที่ให้หรือรับรองโดย TradingView อ่านเพิ่มเติมใน ข้อกำหนดการใช้งาน
การนำเสนอที่เกี่ยวข้อง
คำจำกัดสิทธิ์ความรับผิดชอบ
ข้อมูลและบทความไม่ได้มีวัตถุประสงค์เพื่อก่อให้เกิดกิจกรรมทางการเงิน, การลงทุน, การซื้อขาย, ข้อเสนอแนะ หรือคำแนะนำประเภทอื่น ๆ ที่ให้หรือรับรองโดย TradingView อ่านเพิ่มเติมใน ข้อกำหนดการใช้งาน