
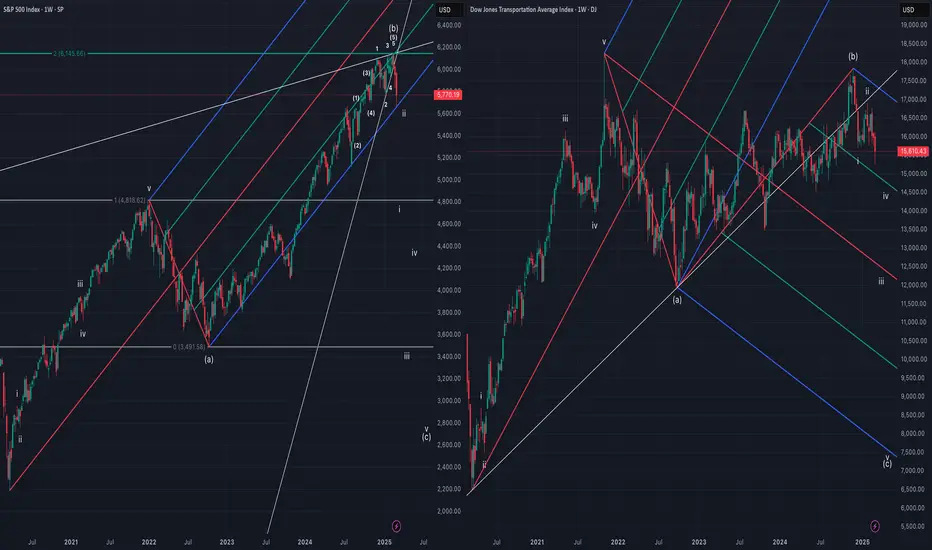
Chart comparing SPX and DJT.
SPX drawn with expanded flat, (b) is 200% of (a) and completes with ending diagonal wedge.
DJT drawn with regular flat, (b) ~90% of (a), wave (c) began in November of 2024 and currently in wave iii of (c).
Bears looking for SPX pitchfork support to break and become resistance, both SPX and DJT looking to eventually break October 2022 low and approach March 2020 lows to complete their corrective structures.

คำจำกัดสิทธิ์ความรับผิดชอบ
ข้อมูลและบทความไม่ได้มีวัตถุประสงค์เพื่อก่อให้เกิดกิจกรรมทางการเงิน, การลงทุน, การซื้อขาย, ข้อเสนอแนะ หรือคำแนะนำประเภทอื่น ๆ ที่ให้หรือรับรองโดย TradingView อ่านเพิ่มเติมใน ข้อกำหนดการใช้งาน
คำจำกัดสิทธิ์ความรับผิดชอบ
ข้อมูลและบทความไม่ได้มีวัตถุประสงค์เพื่อก่อให้เกิดกิจกรรมทางการเงิน, การลงทุน, การซื้อขาย, ข้อเสนอแนะ หรือคำแนะนำประเภทอื่น ๆ ที่ให้หรือรับรองโดย TradingView อ่านเพิ่มเติมใน ข้อกำหนดการใช้งาน