
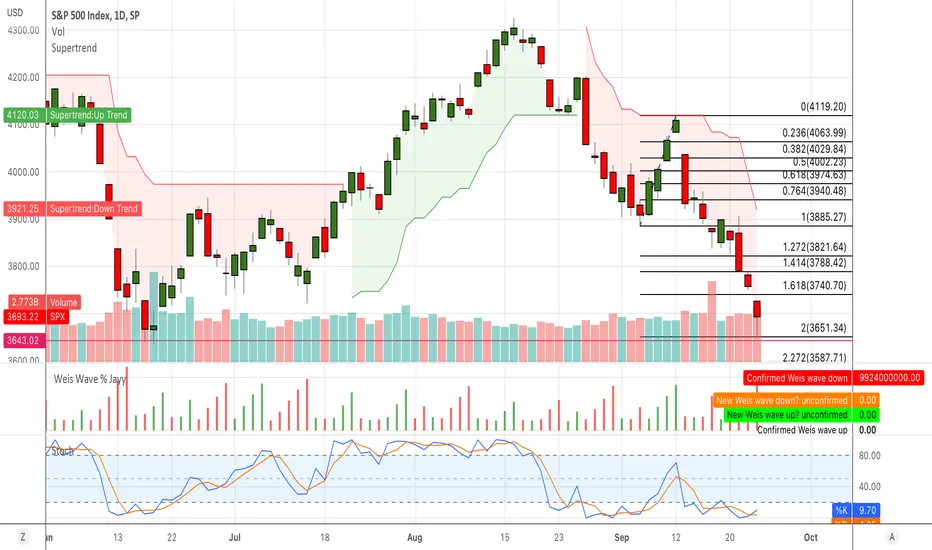
Hammer on the daily chart needs confirmation, but the low price coincides with the Fibonacci level 2 and the static support of the November 2020 high. The stochastic is oversold on the daily, weekly and monthly chart is at 2008 levels. Previous situations always followed by a rebound. On the weekly chart, the rebound occurred followed by an increase in volumes which at this time are still low. Friday's downside stopped at a double low from June 2022. If confirmed, there is a good chance of a rebound. Take care.

คำจำกัดสิทธิ์ความรับผิดชอบ
ข้อมูลและบทความไม่ได้มีวัตถุประสงค์เพื่อก่อให้เกิดกิจกรรมทางการเงิน, การลงทุน, การซื้อขาย, ข้อเสนอแนะ หรือคำแนะนำประเภทอื่น ๆ ที่ให้หรือรับรองโดย TradingView อ่านเพิ่มเติมใน ข้อกำหนดการใช้งาน
คำจำกัดสิทธิ์ความรับผิดชอบ
ข้อมูลและบทความไม่ได้มีวัตถุประสงค์เพื่อก่อให้เกิดกิจกรรมทางการเงิน, การลงทุน, การซื้อขาย, ข้อเสนอแนะ หรือคำแนะนำประเภทอื่น ๆ ที่ให้หรือรับรองโดย TradingView อ่านเพิ่มเติมใน ข้อกำหนดการใช้งาน