
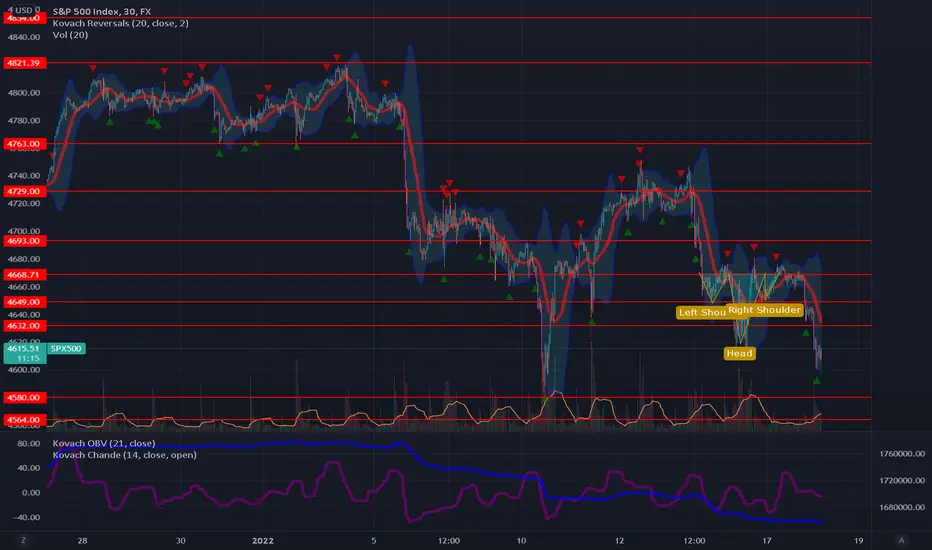
Stocks have broken down hard from our inverse head and shoulders pattern. This should be considered a very bearish sign. We have broken into the vacuum zone between 4632 and 4580, finding support at roughly the midpoint around 4600, a psychological level, which may also become our next addition to technical levels on this chart. The Kovach OBV is quite bearish, but if we see a relief rally, we can expect the S&P 500 to test 4632. We have several levels above this in the 4600 handle, with 4668, the neckline of our inverse H&S a likely ceiling for now. The neckline of a failed H&S pattern always proves to be a significant barrier. From below, 4580 and 4564 should provide support.

Join my discord at discord.io/quantguy
การนำเสนอที่เกี่ยวข้อง
คำจำกัดสิทธิ์ความรับผิดชอบ
ข้อมูลและบทความไม่ได้มีวัตถุประสงค์เพื่อก่อให้เกิดกิจกรรมทางการเงิน, การลงทุน, การซื้อขาย, ข้อเสนอแนะ หรือคำแนะนำประเภทอื่น ๆ ที่ให้หรือรับรองโดย TradingView อ่านเพิ่มเติมใน ข้อกำหนดการใช้งาน
Join my discord at discord.io/quantguy
การนำเสนอที่เกี่ยวข้อง
คำจำกัดสิทธิ์ความรับผิดชอบ
ข้อมูลและบทความไม่ได้มีวัตถุประสงค์เพื่อก่อให้เกิดกิจกรรมทางการเงิน, การลงทุน, การซื้อขาย, ข้อเสนอแนะ หรือคำแนะนำประเภทอื่น ๆ ที่ให้หรือรับรองโดย TradingView อ่านเพิ่มเติมใน ข้อกำหนดการใช้งาน