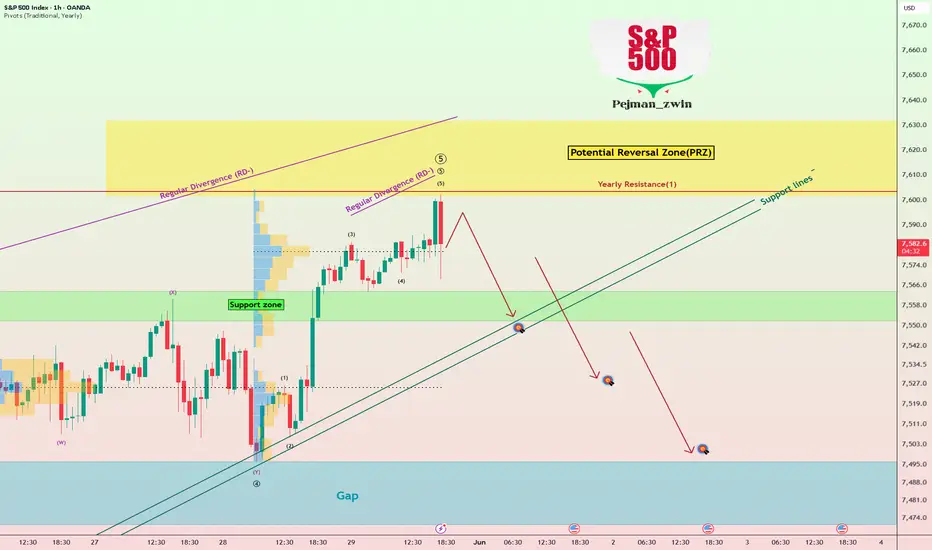
The S&P 500 index( SPX500) has maintained a strong bullish trend over the past one to two months, consistently printing new all-time highs on a weekly basis.
At the moment, the S&P 500 is moving near a Potential Reversal Zone(PRZ)[$7,632-$$7,602].
From an Elliott Wave Theory perspective, it appears the S&P 500 is completing microwave 5 of the main Wave 5, suggesting the bullish cycle is approaching its final stages.
Also, we can see a negative Regular Divergence(RD-) between two consecutive peaks.
I expect that the S&P 500 could experience a notable correction. If the selling momentum increases and key support lines are broken, we could expect lower targets and deeper downside levels for the index.
First Target: $7,531
Second Target: $7,503
Stop Loss(SL): $7,623
Note: Since Bitcoin has shown a strong correlation with the S&P 500 in recent months, a high-momentum correction in the S&P 500 could also impact Bitcoin(
 BTCUSDT) and the broader cryptocurrency market, potentially leading to further downside pressure across digital assets.
What’s your view on the S&P 500? Can it continue its bullish trend and print new all-time highs, or should we expect a larger correction?
💡 Please respect each other's opinions and express agreement or disagreement politely.
📌 S&P 500 Index Analyze (SPX500USD), 1-hour time frame.
🛑 Always set a Stop Loss(SL) for every position you open.
✅ This is just my idea; I’d love to see your thoughts too!
🔥 If you find it helpful, please BOOST this post and share it with your friends.
SPX500) has maintained a strong bullish trend over the past one to two months, consistently printing new all-time highs on a weekly basis.At the moment, the S&P 500 is moving near a Potential Reversal Zone(PRZ)[$7,632-$$7,602].
From an Elliott Wave Theory perspective, it appears the S&P 500 is completing microwave 5 of the main Wave 5, suggesting the bullish cycle is approaching its final stages.
Also, we can see a negative Regular Divergence(RD-) between two consecutive peaks.
I expect that the S&P 500 could experience a notable correction. If the selling momentum increases and key support lines are broken, we could expect lower targets and deeper downside levels for the index.
First Target: $7,531
Second Target: $7,503
Stop Loss(SL): $7,623
Note: Since Bitcoin has shown a strong correlation with the S&P 500 in recent months, a high-momentum correction in the S&P 500 could also impact Bitcoin(
BTCUSDT) and the broader cryptocurrency market, potentially leading to further downside pressure across digital assets.What’s your view on the S&P 500? Can it continue its bullish trend and print new all-time highs, or should we expect a larger correction?
💡 Please respect each other's opinions and express agreement or disagreement politely.
📌 S&P 500 Index Analyze (SPX500USD), 1-hour time frame.
🛑 Always set a Stop Loss(SL) for every position you open.
✅ This is just my idea; I’d love to see your thoughts too!
🔥 If you find it helpful, please BOOST this post and share it with your friends.
การซื้อขายยังคงดำเนินอยู่

🚀 Up to 75% Trading Fee Rebates Across 20+ Exchanges:
🤖 t.me/Protrader365bot
-----
🎁 Free VIP Forex and Crypto Signals, please visit:
🔗 t.me/ProTrader_365
🤖 t.me/Protrader365bot
-----
🎁 Free VIP Forex and Crypto Signals, please visit:
🔗 t.me/ProTrader_365
การนำเสนอที่เกี่ยวข้อง
คำจำกัดสิทธิ์ความรับผิดชอบ
ข้อมูลและบทความไม่ได้มีวัตถุประสงค์เพื่อก่อให้เกิดกิจกรรมทางการเงิน, การลงทุน, การซื้อขาย, ข้อเสนอแนะ หรือคำแนะนำประเภทอื่น ๆ ที่ให้หรือรับรองโดย TradingView อ่านเพิ่มเติมใน ข้อกำหนดการใช้งาน
🚀 Up to 75% Trading Fee Rebates Across 20+ Exchanges:
🤖 t.me/Protrader365bot
-----
🎁 Free VIP Forex and Crypto Signals, please visit:
🔗 t.me/ProTrader_365
🤖 t.me/Protrader365bot
-----
🎁 Free VIP Forex and Crypto Signals, please visit:
🔗 t.me/ProTrader_365
การนำเสนอที่เกี่ยวข้อง
คำจำกัดสิทธิ์ความรับผิดชอบ
ข้อมูลและบทความไม่ได้มีวัตถุประสงค์เพื่อก่อให้เกิดกิจกรรมทางการเงิน, การลงทุน, การซื้อขาย, ข้อเสนอแนะ หรือคำแนะนำประเภทอื่น ๆ ที่ให้หรือรับรองโดย TradingView อ่านเพิ่มเติมใน ข้อกำหนดการใช้งาน