
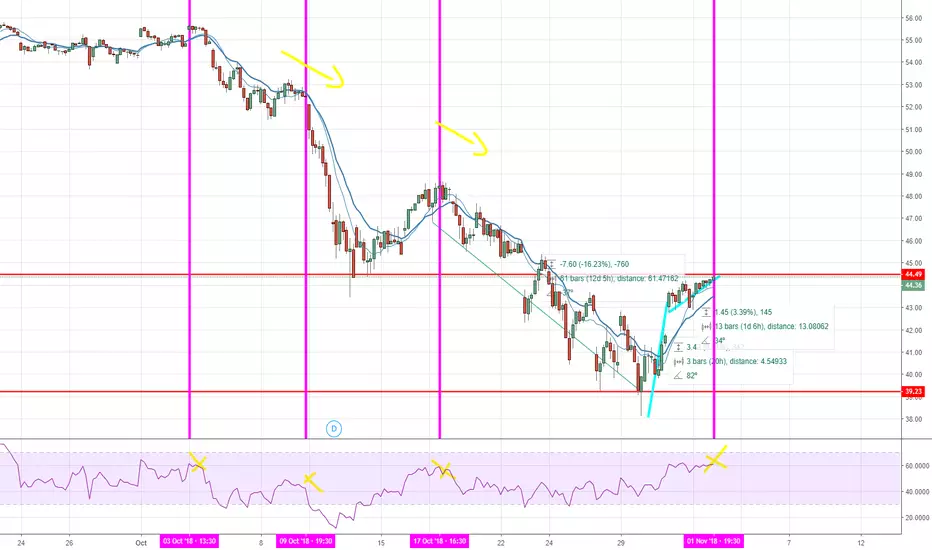
Bull flag vs RSI correction
RSI suggests market correection for tomorrow and next week camdlesticks based on oct 03,09,117 situations. Purple vertical lines shows historic path itself.
Bull Flag
Background: 12 d 5h for -16.23% down
Stick: 20h for +8% up
Flag: 1d 6h +3.39% up
However, there is a huge resistance at 45 price level, so we can expectate another selling wing/breath to break through 50 level
RSI suggests market correection for tomorrow and next week camdlesticks based on oct 03,09,117 situations. Purple vertical lines shows historic path itself.
Bull Flag
Background: 12 d 5h for -16.23% down
Stick: 20h for +8% up
Flag: 1d 6h +3.39% up
However, there is a huge resistance at 45 price level, so we can expectate another selling wing/breath to break through 50 level

คำจำกัดสิทธิ์ความรับผิดชอบ
ข้อมูลและบทความไม่ได้มีวัตถุประสงค์เพื่อก่อให้เกิดกิจกรรมทางการเงิน, การลงทุน, การซื้อขาย, ข้อเสนอแนะ หรือคำแนะนำประเภทอื่น ๆ ที่ให้หรือรับรองโดย TradingView อ่านเพิ่มเติมใน ข้อกำหนดการใช้งาน
คำจำกัดสิทธิ์ความรับผิดชอบ
ข้อมูลและบทความไม่ได้มีวัตถุประสงค์เพื่อก่อให้เกิดกิจกรรมทางการเงิน, การลงทุน, การซื้อขาย, ข้อเสนอแนะ หรือคำแนะนำประเภทอื่น ๆ ที่ให้หรือรับรองโดย TradingView อ่านเพิ่มเติมใน ข้อกำหนดการใช้งาน