
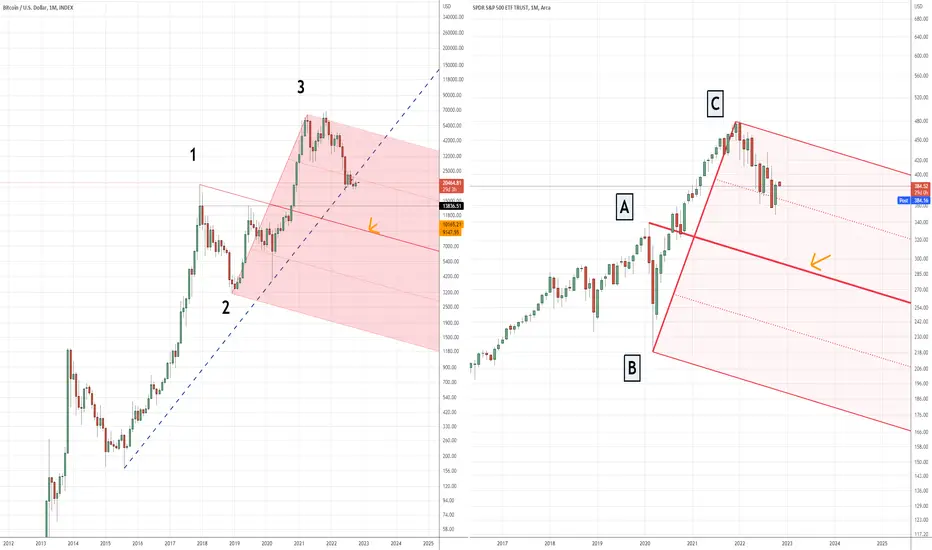
Both in in BTC and SPY charts we have Median Lines that worth a check:
In BTC prices are now under the 50% upside parallel Median Line and the current move could be a pullback of that level, in that case prices could be headed much lower , the Center Line is under 10K right now.
in SPY prices are above the 50% upside parallel but a move back under the 1/2 of the body of the last green candle ( ~373 ) should be seen as an alert to check in case of more downside there to come.
Knowing these patterns may help you have a geometrical map of where price are moving and where could be directed in the future.
No position just sharing the patterns.
In BTC prices are now under the 50% upside parallel Median Line and the current move could be a pullback of that level, in that case prices could be headed much lower , the Center Line is under 10K right now.
in SPY prices are above the 50% upside parallel but a move back under the 1/2 of the body of the last green candle ( ~373 ) should be seen as an alert to check in case of more downside there to come.
Knowing these patterns may help you have a geometrical map of where price are moving and where could be directed in the future.
No position just sharing the patterns.

การนำเสนอที่เกี่ยวข้อง
คำจำกัดสิทธิ์ความรับผิดชอบ
ข้อมูลและบทความไม่ได้มีวัตถุประสงค์เพื่อก่อให้เกิดกิจกรรมทางการเงิน, การลงทุน, การซื้อขาย, ข้อเสนอแนะ หรือคำแนะนำประเภทอื่น ๆ ที่ให้หรือรับรองโดย TradingView อ่านเพิ่มเติมใน ข้อกำหนดการใช้งาน
การนำเสนอที่เกี่ยวข้อง
คำจำกัดสิทธิ์ความรับผิดชอบ
ข้อมูลและบทความไม่ได้มีวัตถุประสงค์เพื่อก่อให้เกิดกิจกรรมทางการเงิน, การลงทุน, การซื้อขาย, ข้อเสนอแนะ หรือคำแนะนำประเภทอื่น ๆ ที่ให้หรือรับรองโดย TradingView อ่านเพิ่มเติมใน ข้อกำหนดการใช้งาน