
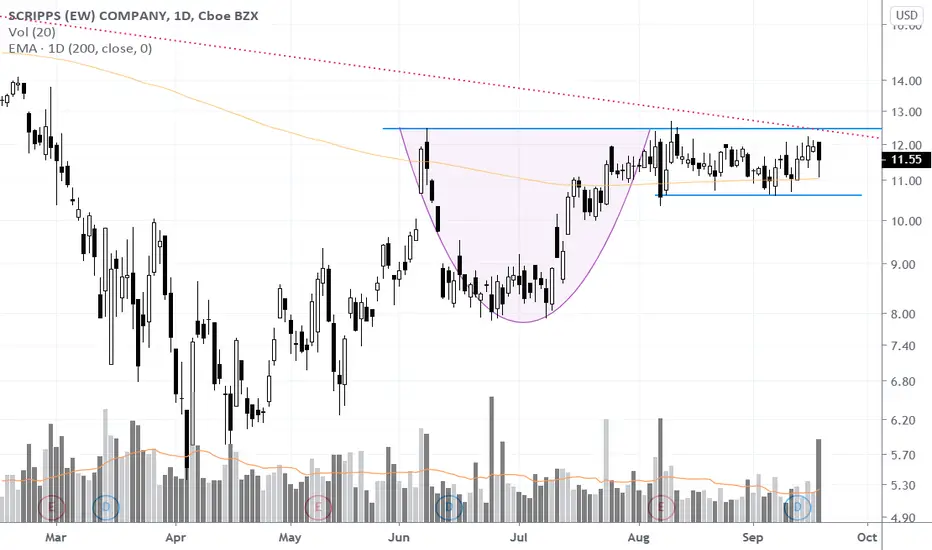
The handle part of the pattern is taking on the shape of 2 month rectangle pattern with $12.50 acting as boundary resistance. Chart patterns that accomplishes 3 things when they breakout are ones that have the most chance succeeding. When the breakout takes place (daily close above $12.50), SSP will:
1) Close above its cup and handle chart pattern (blue line on chart - breakout)
2) Clear a multi month weekly downtrend (red trend line on chart)
3) Clear/Breakaway from the 200 MA (yellow line on the chart)
1) Close above its cup and handle chart pattern (blue line on chart - breakout)
2) Clear a multi month weekly downtrend (red trend line on chart)
3) Clear/Breakaway from the 200 MA (yellow line on the chart)
ออร์เดอร์ถูกยกเลิก
volatile day on September 24th. never closed over chart pattern resistance. Chart is too all over the place. removing from watch list.
✔ Momentum & Breakout Trader Since 2006 | Influenced by Mark Minervini VCP Trading Style & William O'Neil CANSLIM 📈
✔ Follow me on Twitter @taplot - twitter.com/TaPlot
✔ YouTube channel youtube.com/@taplot
✔ Follow me on Twitter @taplot - twitter.com/TaPlot
✔ YouTube channel youtube.com/@taplot
คำจำกัดสิทธิ์ความรับผิดชอบ
ข้อมูลและบทความไม่ได้มีวัตถุประสงค์เพื่อก่อให้เกิดกิจกรรมทางการเงิน, การลงทุน, การซื้อขาย, ข้อเสนอแนะ หรือคำแนะนำประเภทอื่น ๆ ที่ให้หรือรับรองโดย TradingView อ่านเพิ่มเติมใน ข้อกำหนดการใช้งาน
✔ Momentum & Breakout Trader Since 2006 | Influenced by Mark Minervini VCP Trading Style & William O'Neil CANSLIM 📈
✔ Follow me on Twitter @taplot - twitter.com/TaPlot
✔ YouTube channel youtube.com/@taplot
✔ Follow me on Twitter @taplot - twitter.com/TaPlot
✔ YouTube channel youtube.com/@taplot
คำจำกัดสิทธิ์ความรับผิดชอบ
ข้อมูลและบทความไม่ได้มีวัตถุประสงค์เพื่อก่อให้เกิดกิจกรรมทางการเงิน, การลงทุน, การซื้อขาย, ข้อเสนอแนะ หรือคำแนะนำประเภทอื่น ๆ ที่ให้หรือรับรองโดย TradingView อ่านเพิ่มเติมใน ข้อกำหนดการใช้งาน