ที่อัปเดต:
SXP - LONG-TERM
Woop, good morning traders,
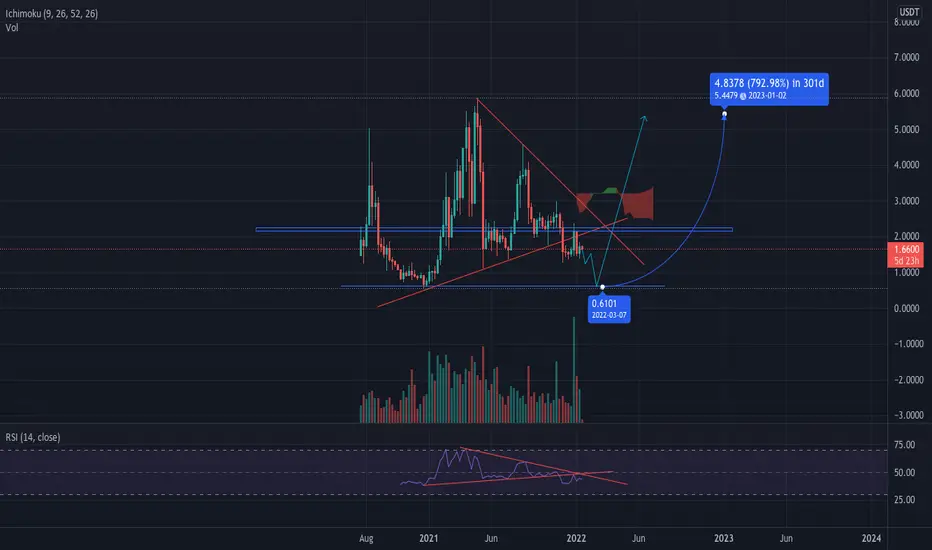
Look at SXP, whether it is deepest bottom or not. Actually, I never try to guess what will happen. I just look at candle stick, it always say a story to you. Current now, SXP has some key points :
1. Triangle pattern had been created and price broke bottom trend line.
2. At local strong support 2.0-2.3, bearish engulfing pattern had been completed, that mean retest fail.
3. RSI triangle also broke and under 50, it will move quickly to overbought area when price drops deeper.
By these analysts above, highly price will sink deeper to 0.7-1.0. Now, just keep patient and observe
Look at SXP, whether it is deepest bottom or not. Actually, I never try to guess what will happen. I just look at candle stick, it always say a story to you. Current now, SXP has some key points :
1. Triangle pattern had been created and price broke bottom trend line.
2. At local strong support 2.0-2.3, bearish engulfing pattern had been completed, that mean retest fail.
3. RSI triangle also broke and under 50, it will move quickly to overbought area when price drops deeper.
By these analysts above, highly price will sink deeper to 0.7-1.0. Now, just keep patient and observe
บันทึก
Do u still remember this coin??? It is moving as my plan. 
คำจำกัดสิทธิ์ความรับผิดชอบ
ข้อมูลและบทความไม่ได้มีวัตถุประสงค์เพื่อก่อให้เกิดกิจกรรมทางการเงิน, การลงทุน, การซื้อขาย, ข้อเสนอแนะ หรือคำแนะนำประเภทอื่น ๆ ที่ให้หรือรับรองโดย TradingView อ่านเพิ่มเติมใน ข้อกำหนดการใช้งาน
คำจำกัดสิทธิ์ความรับผิดชอบ
ข้อมูลและบทความไม่ได้มีวัตถุประสงค์เพื่อก่อให้เกิดกิจกรรมทางการเงิน, การลงทุน, การซื้อขาย, ข้อเสนอแนะ หรือคำแนะนำประเภทอื่น ๆ ที่ให้หรือรับรองโดย TradingView อ่านเพิ่มเติมใน ข้อกำหนดการใช้งาน