
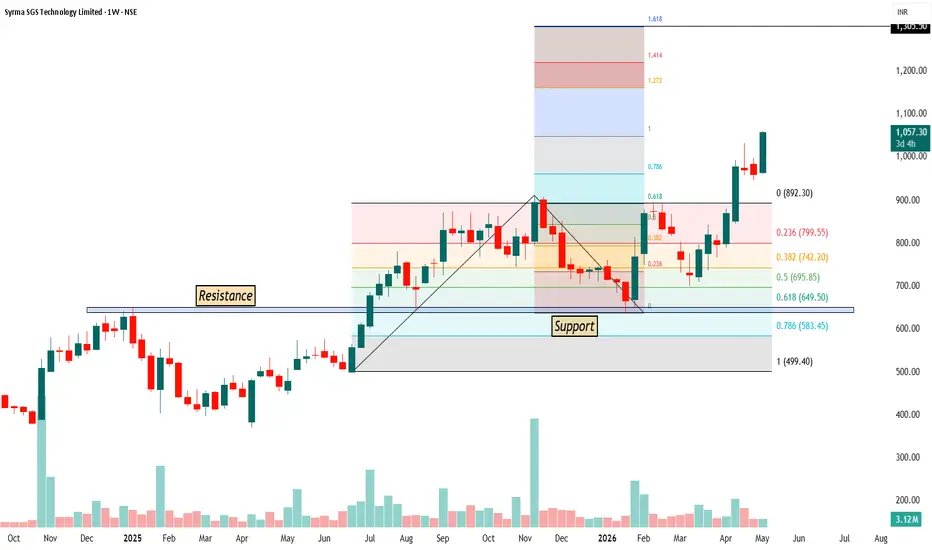
First, the normal Fibonacci retracement is applied from the swing low to the swing high to understand where price can take support during a pullback. In this chart, price came down into the 0.5 to 0.618 zone, which is considered a strong buying area. This zone also matched with the horizontal support, so buyers entered from there and pushed the price up.
Now coming to the trend-based Fibonacci, it is used to understand the continuation of the trend and future targets. For this, we take three points — swing low, swing high, and the pullback low. Once applied, it gives extension levels where price can move next.
In this case, after the pullback, price started moving up strongly, which confirms trend continuation. As per the trend-based Fibonacci, the next targets are around 1.272 near 1200, 1.414 near 1250, and 1.618 near 1300 levels.
So overall, Fibonacci retracement helped us find the buying zone, and trend-based Fibonacci is helping us project the targets in the ongoing uptrend.

คำจำกัดสิทธิ์ความรับผิดชอบ
ข้อมูลและบทความไม่ได้มีวัตถุประสงค์เพื่อก่อให้เกิดกิจกรรมทางการเงิน, การลงทุน, การซื้อขาย, ข้อเสนอแนะ หรือคำแนะนำประเภทอื่น ๆ ที่ให้หรือรับรองโดย TradingView อ่านเพิ่มเติมใน ข้อกำหนดการใช้งาน
คำจำกัดสิทธิ์ความรับผิดชอบ
ข้อมูลและบทความไม่ได้มีวัตถุประสงค์เพื่อก่อให้เกิดกิจกรรมทางการเงิน, การลงทุน, การซื้อขาย, ข้อเสนอแนะ หรือคำแนะนำประเภทอื่น ๆ ที่ให้หรือรับรองโดย TradingView อ่านเพิ่มเติมใน ข้อกำหนดการใช้งาน