
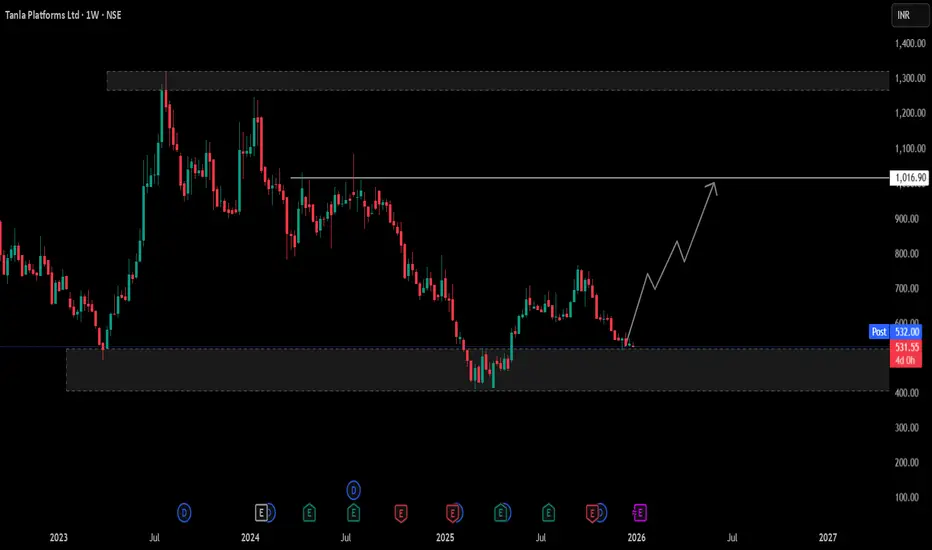
The stock is trading near a major demand zone around ₹500–520, where price has previously taken strong support. Current structure indicates a potential base formation with initial higher-low attempts visible. If the price sustains above this support zone, a relief rally toward the ₹800–900 zone is likely, with major resistance placed near ₹1,150–1,200, where multiple rejections occurred earlier. A breakdown below the support zone may invalidate the bullish structure.
Trend Bias: Accumulation to early reversal zone
Key Support: ₹500–520
Resistance Levels: ₹800–900 and ₹1,150–1,200
Disclaimer: This is a technical analysis view for educational purposes only, not investment or trading advice. Market conditions may change, so please do your own research or consult a financial advisor before making any decisions.
Trend Bias: Accumulation to early reversal zone
Key Support: ₹500–520
Resistance Levels: ₹800–900 and ₹1,150–1,200
Disclaimer: This is a technical analysis view for educational purposes only, not investment or trading advice. Market conditions may change, so please do your own research or consult a financial advisor before making any decisions.

คำจำกัดสิทธิ์ความรับผิดชอบ
ข้อมูลและบทความไม่ได้มีวัตถุประสงค์เพื่อก่อให้เกิดกิจกรรมทางการเงิน, การลงทุน, การซื้อขาย, ข้อเสนอแนะ หรือคำแนะนำประเภทอื่น ๆ ที่ให้หรือรับรองโดย TradingView อ่านเพิ่มเติมใน ข้อกำหนดการใช้งาน
คำจำกัดสิทธิ์ความรับผิดชอบ
ข้อมูลและบทความไม่ได้มีวัตถุประสงค์เพื่อก่อให้เกิดกิจกรรมทางการเงิน, การลงทุน, การซื้อขาย, ข้อเสนอแนะ หรือคำแนะนำประเภทอื่น ๆ ที่ให้หรือรับรองโดย TradingView อ่านเพิ่มเติมใน ข้อกำหนดการใช้งาน