
Timeframe & Macro Trend:
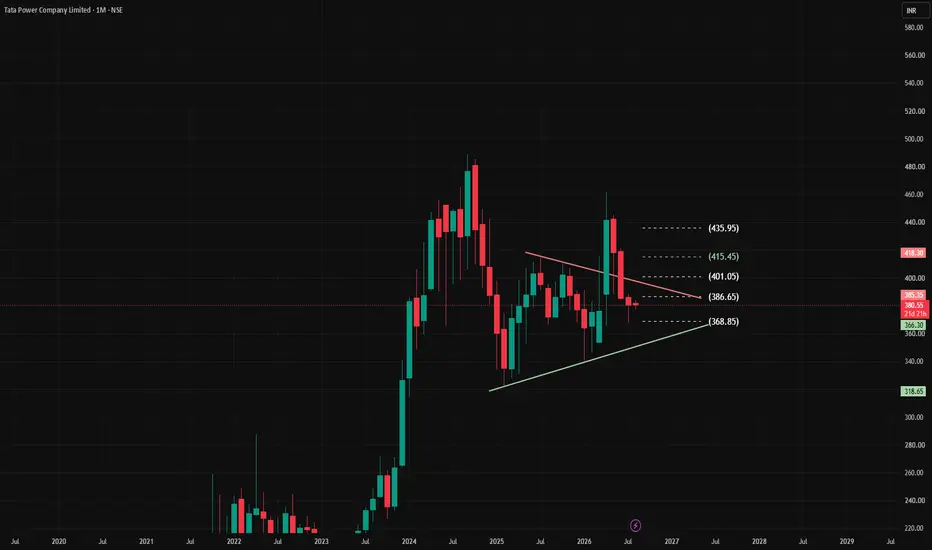
The Monthly (1M) chart demonstrates a macro bull run that topped near the ~490 zone before entering a multi-month consolidation phase.
The price action is currently coiling inside a large symmetrical triangle / wedge pattern, characterized by lower highs and higher lows.
Current Price Action & Pattern Dynamics:
Price is presently trading near 380.55, lingering near the lower boundary of the triangle structure.
The narrowing price range reflects volatility contraction, signaling that a high-momentum expansion move is building up as the structure reaches its apex.
Key Technical Levels:
Resistance Levels:
386.65 & 401.05: Immediate resistance zone and upper descending trendline barrier.
415.45 & 435.95: Major overhead resistance targets upon a successful bullish breakout.
Support Levels:
368.85: Crucial trendline support (ascending green trendline). Holding above this level maintains the integrity of the bullish wedge.
318.65: Strong structural horizontal base support in the event of a breakdown below the triangle.
The Monthly (1M) chart demonstrates a macro bull run that topped near the ~490 zone before entering a multi-month consolidation phase.
The price action is currently coiling inside a large symmetrical triangle / wedge pattern, characterized by lower highs and higher lows.
Current Price Action & Pattern Dynamics:
Price is presently trading near 380.55, lingering near the lower boundary of the triangle structure.
The narrowing price range reflects volatility contraction, signaling that a high-momentum expansion move is building up as the structure reaches its apex.
Key Technical Levels:
Resistance Levels:
386.65 & 401.05: Immediate resistance zone and upper descending trendline barrier.
415.45 & 435.95: Major overhead resistance targets upon a successful bullish breakout.
Support Levels:
368.85: Crucial trendline support (ascending green trendline). Holding above this level maintains the integrity of the bullish wedge.
318.65: Strong structural horizontal base support in the event of a breakdown below the triangle.
การซื้อขายยังคงดำเนินอยู่
Monthly close below Monthly trendline....seems very bearish

การนำเสนอที่เกี่ยวข้อง
คำจำกัดสิทธิ์ความรับผิดชอบ
ข้อมูลและบทความไม่ได้มีวัตถุประสงค์เพื่อก่อให้เกิดกิจกรรมทางการเงิน, การลงทุน, การซื้อขาย, ข้อเสนอแนะ หรือคำแนะนำประเภทอื่น ๆ ที่ให้หรือรับรองโดย TradingView อ่านเพิ่มเติมใน ข้อกำหนดการใช้งาน
การนำเสนอที่เกี่ยวข้อง
คำจำกัดสิทธิ์ความรับผิดชอบ
ข้อมูลและบทความไม่ได้มีวัตถุประสงค์เพื่อก่อให้เกิดกิจกรรมทางการเงิน, การลงทุน, การซื้อขาย, ข้อเสนอแนะ หรือคำแนะนำประเภทอื่น ๆ ที่ให้หรือรับรองโดย TradingView อ่านเพิ่มเติมใน ข้อกำหนดการใช้งาน