
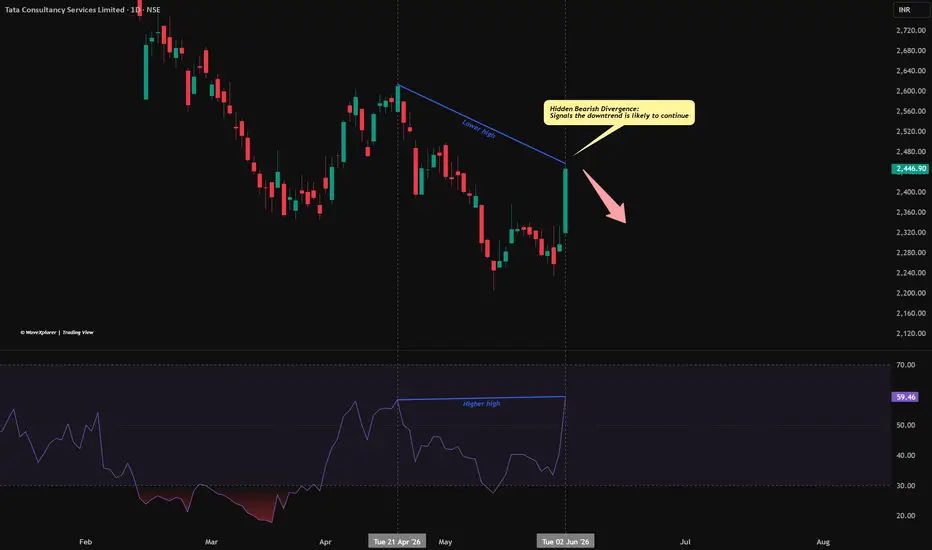
The recent sharp jump in Tata Consultancy Services (TCS) has certainly caught a lot of eyes. On the surface, that large green candle looks very strong. But if we dig a bit deeper into the relationship between price and momentum, there is an interesting technical puzzle on the daily chart as shown in chart.
Let’s break down what the chart is showing without any bias:
The Price vs. Indicator Clash
If you look at the blue lines on the chart connecting the mid-April peaks to the current June peaks, you will notice a clear disagreement:
Two Scenarios to Watch Next
Because the market can always surprise us, it is best to watch how price reacts to these levels rather than guessing:
It is a classic, textbook example of momentum clashing with price action. Let's see how the market resolves this over the next few sessions.
Disclaimer: This post is for educational purposes only and is not financial advice. I am not a SEBI-registered analyst. Please do your own research and manage your risk carefully.
Let’s break down what the chart is showing without any bias:
The Price vs. Indicator Clash
If you look at the blue lines on the chart connecting the mid-April peaks to the current June peaks, you will notice a clear disagreement:
- The Price Chart: Is making a Lower High. This means the stock price has not managed to climb back to its previous April peak, keeping the broader structure in a downward slope.
- The RSI Indicator: Is making a Higher High. The momentum indicator has pushed up higher than it did in April.
What is Hidden Bearish Divergence?
In simple terms, this combination is known as a Hidden Bearish Divergence. It happens when the indicator works extra hard (gaining more momentum), but the actual stock price fails to reflect that strength by making a new high. Historically, chartists view this as a sign that the broader downward trend is still heavy and might want to continue.
Two Scenarios to Watch Next
Because the market can always surprise us, it is best to watch how price reacts to these levels rather than guessing:
- The Bearish Case: If the divergence holds true, this recent rally might just be a temporary bounce, and we could see the stock resume its steady downward path.
- The Bullish Case: If buyers keep up the intense pressure and manage to push the price cleanly above the April peak, it would invalidate this divergence and open up potential for a stronger structural reversal.
It is a classic, textbook example of momentum clashing with price action. Let's see how the market resolves this over the next few sessions.
Disclaimer: This post is for educational purposes only and is not financial advice. I am not a SEBI-registered analyst. Please do your own research and manage your risk carefully.

WaveXplorer | Elliott Wave insights
📊 X profile: @veerappa89
📊 X profile: @veerappa89
การนำเสนอที่เกี่ยวข้อง
คำจำกัดสิทธิ์ความรับผิดชอบ
ข้อมูลและบทความไม่ได้มีวัตถุประสงค์เพื่อก่อให้เกิดกิจกรรมทางการเงิน, การลงทุน, การซื้อขาย, ข้อเสนอแนะ หรือคำแนะนำประเภทอื่น ๆ ที่ให้หรือรับรองโดย TradingView อ่านเพิ่มเติมใน ข้อกำหนดการใช้งาน
WaveXplorer | Elliott Wave insights
📊 X profile: @veerappa89
📊 X profile: @veerappa89
การนำเสนอที่เกี่ยวข้อง
คำจำกัดสิทธิ์ความรับผิดชอบ
ข้อมูลและบทความไม่ได้มีวัตถุประสงค์เพื่อก่อให้เกิดกิจกรรมทางการเงิน, การลงทุน, การซื้อขาย, ข้อเสนอแนะ หรือคำแนะนำประเภทอื่น ๆ ที่ให้หรือรับรองโดย TradingView อ่านเพิ่มเติมใน ข้อกำหนดการใช้งาน