
📌 Overview
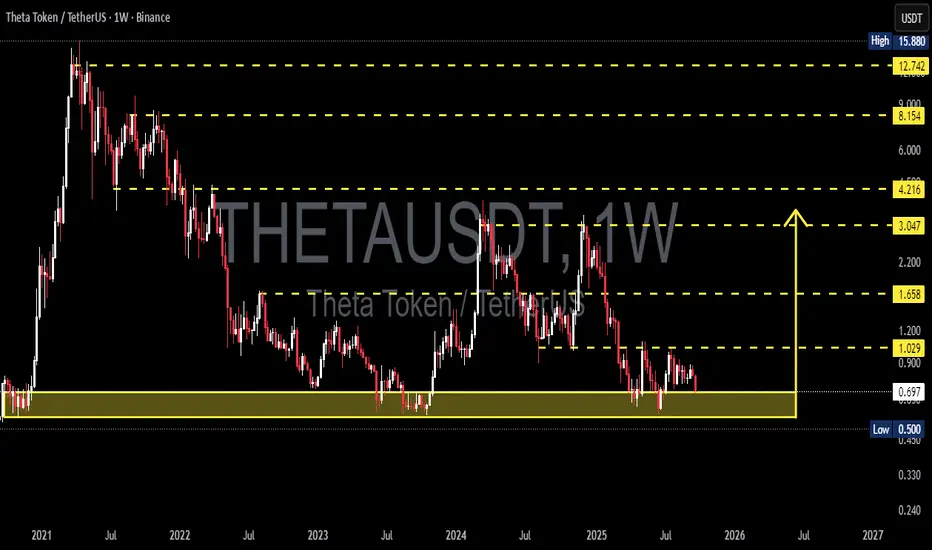
THETA is currently trading at a critical decision point, sitting right inside the multi-year demand zone of $0.50–$0.75, with the price hovering around $0.694. This area has acted as a strong base since 2021, and the next move will determine whether THETA is gearing up for a major rebound or facing another leg down in its prolonged bearish trend.
---
🔹 Structure & Pattern Analysis
Macro Trend: Since hitting the all-time high of $15.88 in 2021, THETA has consistently formed lower highs, showing a dominant bearish structure.
Key Demand Zone: The $0.50–$0.75 range has acted as a long-term floor for more than 3 years.
Chart Pattern: The structure resembles a descending triangle (flat support with lower highs), a pattern that usually favors breakdowns — though invalidation remains possible with a confirmed breakout to the upside.
Accumulation Hints: Decreasing sell volume during each retest of the demand zone suggests seller exhaustion and potential long-term accumulation.
---
🔹 Bullish Scenario
1. Strong Rebound From Demand Zone
If THETA holds above $0.50–$0.75 and prints a strong bullish weekly candle (hammer or engulfing), it may signal accumulation strength.
2. First Confirmation:
A weekly close above $1.03 (immediate resistance) → signals that buyers are regaining control.
3. Upside Targets:
Target 1: $1.66
Target 2: $3.05
Target 3: $4.22
Breaking higher could extend toward $8.15 – $12.74, and possibly retest the ATH at $15.88 in the long run.
4. Momentum Validation:
RSI reclaiming >50 + MACD bullish cross would strengthen the bullish case.
---
🔹 Bearish Scenario
1. Confirmed Breakdown Below $0.50
A weekly close below $0.50 would confirm a bearish continuation and invalidate the demand zone.
2. Failed Retest:
If the price retests $0.50–$0.55 and fails to reclaim, it could trigger accelerated selling pressure.
3. Downside Targets:
Target 1: $0.33
Target 2: $0.24 (multi-year bottom)
4. Risk:
A breakdown below $0.50 may cause capitulation, with long-term holders potentially exiting positions.
---
🔹 Trading Strategy & Risk Management
Long-Term Investors (DCA): Gradual accumulation within $0.50–$0.75, with a conservative stop loss below $0.45.
Swing Traders: Enter long after a confirmed breakout and weekly close above $1.03, targeting $1.66+.
Bearish Traders: Short setups become valid if weekly closes below $0.50, with targets toward $0.33–$0.24.
Risk Control: Always apply stop losses. Maintain a minimum risk-to-reward ratio of 1:2 before entering.
---
🔹 Conclusion
THETA is standing at a make-or-break zone.
As long as it holds above the $0.50–$0.75 demand zone, the potential for a major rebound remains alive, especially if $1.03 is broken to the upside.
However, a weekly close below $0.50 would confirm a bearish continuation, opening the path to new lows.
The upcoming weekly closes will be decisive — the next candles could shape THETA’s direction not just for months, but potentially for years.
---
#THETA #Crypto #Altcoin #TechnicalAnalysis #PriceAction #SupportResistance #Breakout #Breakdown #CryptoTrading
THETA is currently trading at a critical decision point, sitting right inside the multi-year demand zone of $0.50–$0.75, with the price hovering around $0.694. This area has acted as a strong base since 2021, and the next move will determine whether THETA is gearing up for a major rebound or facing another leg down in its prolonged bearish trend.
---
🔹 Structure & Pattern Analysis
Macro Trend: Since hitting the all-time high of $15.88 in 2021, THETA has consistently formed lower highs, showing a dominant bearish structure.
Key Demand Zone: The $0.50–$0.75 range has acted as a long-term floor for more than 3 years.
Chart Pattern: The structure resembles a descending triangle (flat support with lower highs), a pattern that usually favors breakdowns — though invalidation remains possible with a confirmed breakout to the upside.
Accumulation Hints: Decreasing sell volume during each retest of the demand zone suggests seller exhaustion and potential long-term accumulation.
---
🔹 Bullish Scenario
1. Strong Rebound From Demand Zone
If THETA holds above $0.50–$0.75 and prints a strong bullish weekly candle (hammer or engulfing), it may signal accumulation strength.
2. First Confirmation:
A weekly close above $1.03 (immediate resistance) → signals that buyers are regaining control.
3. Upside Targets:
Target 1: $1.66
Target 2: $3.05
Target 3: $4.22
Breaking higher could extend toward $8.15 – $12.74, and possibly retest the ATH at $15.88 in the long run.
4. Momentum Validation:
RSI reclaiming >50 + MACD bullish cross would strengthen the bullish case.
---
🔹 Bearish Scenario
1. Confirmed Breakdown Below $0.50
A weekly close below $0.50 would confirm a bearish continuation and invalidate the demand zone.
2. Failed Retest:
If the price retests $0.50–$0.55 and fails to reclaim, it could trigger accelerated selling pressure.
3. Downside Targets:
Target 1: $0.33
Target 2: $0.24 (multi-year bottom)
4. Risk:
A breakdown below $0.50 may cause capitulation, with long-term holders potentially exiting positions.
---
🔹 Trading Strategy & Risk Management
Long-Term Investors (DCA): Gradual accumulation within $0.50–$0.75, with a conservative stop loss below $0.45.
Swing Traders: Enter long after a confirmed breakout and weekly close above $1.03, targeting $1.66+.
Bearish Traders: Short setups become valid if weekly closes below $0.50, with targets toward $0.33–$0.24.
Risk Control: Always apply stop losses. Maintain a minimum risk-to-reward ratio of 1:2 before entering.
---
🔹 Conclusion
THETA is standing at a make-or-break zone.
As long as it holds above the $0.50–$0.75 demand zone, the potential for a major rebound remains alive, especially if $1.03 is broken to the upside.
However, a weekly close below $0.50 would confirm a bearish continuation, opening the path to new lows.
The upcoming weekly closes will be decisive — the next candles could shape THETA’s direction not just for months, but potentially for years.
---
#THETA #Crypto #Altcoin #TechnicalAnalysis #PriceAction #SupportResistance #Breakout #Breakdown #CryptoTrading

✅ Get Free Signals! Join Our Telegram Channel Here: t.me/TheCryptoNuclear
✅ Twitter: twitter.com/crypto_nuclear
✅ Join Bybit : partner.bybit.com/b/nuclearvip
✅ Benefits : Lifetime Trading Fee Discount -50%
✅ Twitter: twitter.com/crypto_nuclear
✅ Join Bybit : partner.bybit.com/b/nuclearvip
✅ Benefits : Lifetime Trading Fee Discount -50%
คำจำกัดสิทธิ์ความรับผิดชอบ
ข้อมูลและบทความไม่ได้มีวัตถุประสงค์เพื่อก่อให้เกิดกิจกรรมทางการเงิน, การลงทุน, การซื้อขาย, ข้อเสนอแนะ หรือคำแนะนำประเภทอื่น ๆ ที่ให้หรือรับรองโดย TradingView อ่านเพิ่มเติมใน ข้อกำหนดการใช้งาน
✅ Get Free Signals! Join Our Telegram Channel Here: t.me/TheCryptoNuclear
✅ Twitter: twitter.com/crypto_nuclear
✅ Join Bybit : partner.bybit.com/b/nuclearvip
✅ Benefits : Lifetime Trading Fee Discount -50%
✅ Twitter: twitter.com/crypto_nuclear
✅ Join Bybit : partner.bybit.com/b/nuclearvip
✅ Benefits : Lifetime Trading Fee Discount -50%
คำจำกัดสิทธิ์ความรับผิดชอบ
ข้อมูลและบทความไม่ได้มีวัตถุประสงค์เพื่อก่อให้เกิดกิจกรรมทางการเงิน, การลงทุน, การซื้อขาย, ข้อเสนอแนะ หรือคำแนะนำประเภทอื่น ๆ ที่ให้หรือรับรองโดย TradingView อ่านเพิ่มเติมใน ข้อกำหนดการใช้งาน