
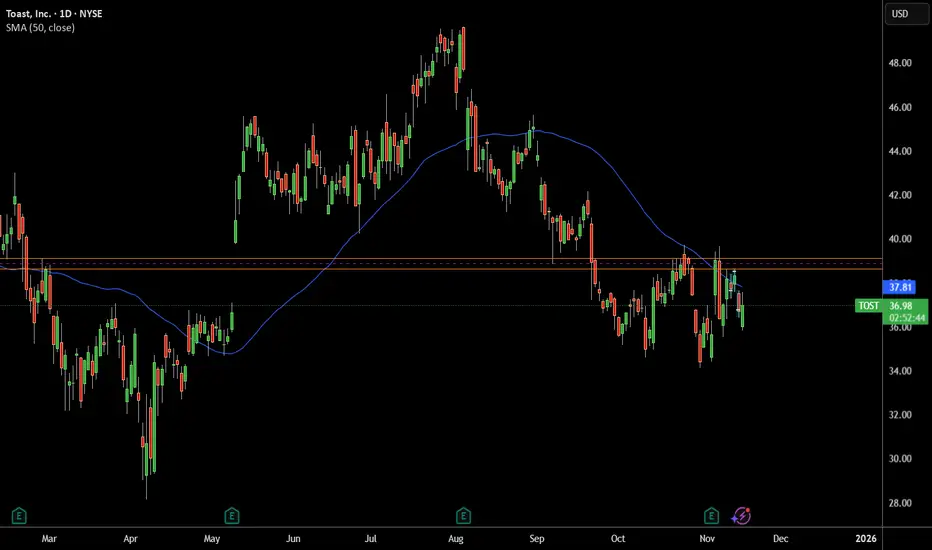
Price Rejected From Major Resistance
The stock is sitting right below a heavy resistance zone around $38–40, which has rejected price multiple times in the past.
Every time TOST comes near this zone, sellers step in → clear bearish supply area.
2. Below the 50-Day Moving Average
Price is trading under the 50 SMA (blue line).
In downtrending or weak stocks, the 50 SMA acts as dynamic resistance, pushing price lower.
3. Lower Highs Formation
The recent bounce failed to create a higher high.
Instead, TOST is forming lower highs, which is a classic bearish continuation signal.
4. Failed Breakout Attempt
TOST tried to break above the resistance but got instantly sold off.
This is a sign of weak buying demand and strong sellers.
ปิดการเทรด: ถึงเป้าหมายการทำกำไร

คำจำกัดสิทธิ์ความรับผิดชอบ
ข้อมูลและบทความไม่ได้มีวัตถุประสงค์เพื่อก่อให้เกิดกิจกรรมทางการเงิน, การลงทุน, การซื้อขาย, ข้อเสนอแนะ หรือคำแนะนำประเภทอื่น ๆ ที่ให้หรือรับรองโดย TradingView อ่านเพิ่มเติมใน ข้อกำหนดการใช้งาน
คำจำกัดสิทธิ์ความรับผิดชอบ
ข้อมูลและบทความไม่ได้มีวัตถุประสงค์เพื่อก่อให้เกิดกิจกรรมทางการเงิน, การลงทุน, การซื้อขาย, ข้อเสนอแนะ หรือคำแนะนำประเภทอื่น ๆ ที่ให้หรือรับรองโดย TradingView อ่านเพิ่มเติมใน ข้อกำหนดการใช้งาน