
#TRXUSDT
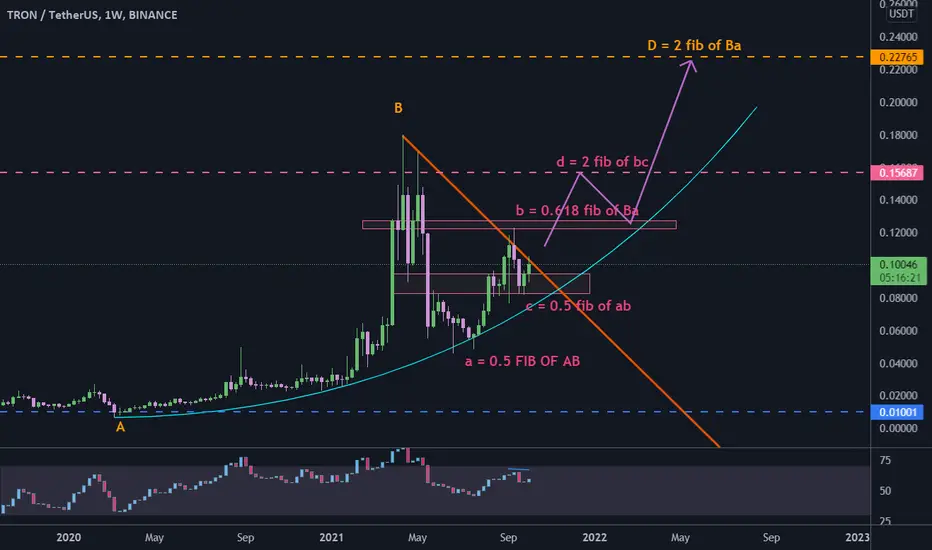
 TRX is trading below a descending resistance line, although price hold above the support zone.
bullish scenario: breaking above the resistance line can lead price upward to touch $0.156 in midterm, and $0.22 in long term as you can see the fib ratios for AB=CD pattern.
bearish scenario: if price break down below support zone, next support is around $0.05 and then $0.01.
TRX is trading below a descending resistance line, although price hold above the support zone.bullish scenario: breaking above the resistance line can lead price upward to touch $0.156 in midterm, and $0.22 in long term as you can see the fib ratios for AB=CD pattern.
bearish scenario: if price break down below support zone, next support is around $0.05 and then $0.01.
บันทึก
#XTZ/USDT
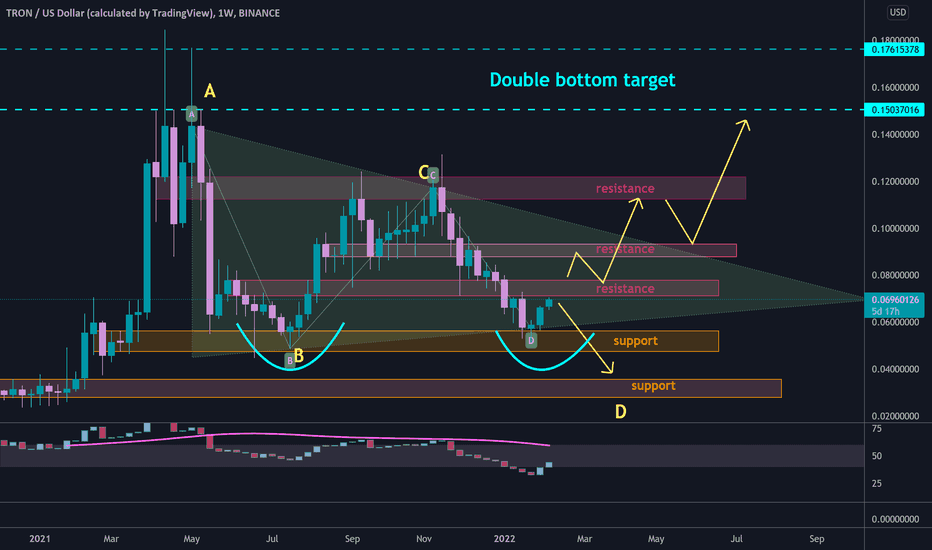
 XTZ rejected from support zone , and reached a resistance zone .
🐮 if price hold the support zone , and break out from resistance zone around $0.077, so it is going up to touch upper line of triangle around resistance zone of $0.09.
🐮🐮 break out from triangle will help price increase more to complete double bottom pattern at $0.15 and $0.176.
🐻 break down from lower line of triangle and support zone , will drop price to complete AB=CD pattern around $0.03

คำจำกัดสิทธิ์ความรับผิดชอบ
ข้อมูลและบทความไม่ได้มีวัตถุประสงค์เพื่อก่อให้เกิดกิจกรรมทางการเงิน, การลงทุน, การซื้อขาย, ข้อเสนอแนะ หรือคำแนะนำประเภทอื่น ๆ ที่ให้หรือรับรองโดย TradingView อ่านเพิ่มเติมใน ข้อกำหนดการใช้งาน
คำจำกัดสิทธิ์ความรับผิดชอบ
ข้อมูลและบทความไม่ได้มีวัตถุประสงค์เพื่อก่อให้เกิดกิจกรรมทางการเงิน, การลงทุน, การซื้อขาย, ข้อเสนอแนะ หรือคำแนะนำประเภทอื่น ๆ ที่ให้หรือรับรองโดย TradingView อ่านเพิ่มเติมใน ข้อกำหนดการใช้งาน