
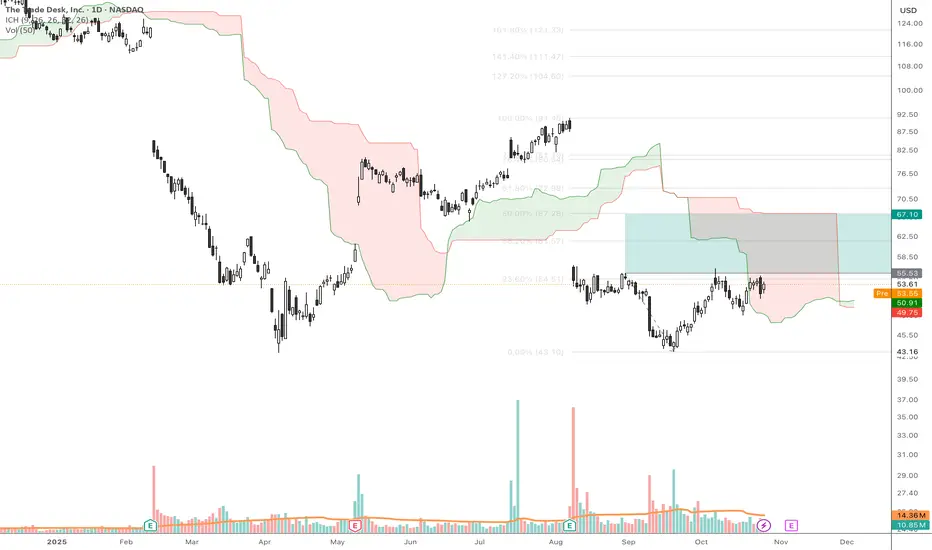
A potential inverse Head & Shoulders formation appears to be developing on The Trade Desk (TTD) daily chart.
The neckline sits near 55.56.
A break and close above 55.56 could trigger the pattern, with an upside target around 67.28 based on the measured move. The target aligned with both the 50% Fibonacci retracement and the Ichimoku Senkou Span B — a key confluence area.
Invalidation lies below 48.54; a breakdown there would negate the setup.
Focus on the chart, not the headlines.
(Educational idea – not financial advice.)
The neckline sits near 55.56.
A break and close above 55.56 could trigger the pattern, with an upside target around 67.28 based on the measured move. The target aligned with both the 50% Fibonacci retracement and the Ichimoku Senkou Span B — a key confluence area.
Invalidation lies below 48.54; a breakdown there would negate the setup.
Focus on the chart, not the headlines.
(Educational idea – not financial advice.)

คำจำกัดสิทธิ์ความรับผิดชอบ
ข้อมูลและบทความไม่ได้มีวัตถุประสงค์เพื่อก่อให้เกิดกิจกรรมทางการเงิน, การลงทุน, การซื้อขาย, ข้อเสนอแนะ หรือคำแนะนำประเภทอื่น ๆ ที่ให้หรือรับรองโดย TradingView อ่านเพิ่มเติมใน ข้อกำหนดการใช้งาน
คำจำกัดสิทธิ์ความรับผิดชอบ
ข้อมูลและบทความไม่ได้มีวัตถุประสงค์เพื่อก่อให้เกิดกิจกรรมทางการเงิน, การลงทุน, การซื้อขาย, ข้อเสนอแนะ หรือคำแนะนำประเภทอื่น ๆ ที่ให้หรือรับรองโดย TradingView อ่านเพิ่มเติมใน ข้อกำหนดการใช้งาน