
A) LIQUIDITY REGIME (Tier 1 & 2)
The FTSE 100 is currently navigating a complex global liquidity environment as we approach mid-May 2026:
• BoE Policy & Inflation:
While the Fed has signaled a hawkish pause, the Bank of England (BoE) is facing a stickier inflation profile, with CPI near 3.4% YoY. This keeps yields elevated and limits the expansionary “cheap money” tailwind for UK equities.
• DXY & GBP/USD:
The U.S. Dollar Index (DXY) remains pressured below 98.00. However, relative GBP strength acts as a headwind for FTSE multinational exporters, as overseas earnings convert less favorably into sterling.
• Global Liquidity (M2 / TGA):
Global liquidity remains in a controlled expansion phase. The US Treasury General Account (TGA) around $860B indicates no active liquidity drain, providing a stable macro floor for risk assets.
---
B) RISK & INFLATION REGIME (Tier 1 & 3)
• Commodity Influence:
The FTSE 100 is heavily weighted toward energy and mining. With oil stabilizing after geopolitical volatility, the inflation-hedging component of the index is currently neutral.
• VIX Context:
With the VIX at 17.19, risk appetite remains cautiously constructive. However, proximity to key resistance increases the probability of localized volatility expansion.
---
C) TECHNICAL & ORDER FLOW STRUCTURE
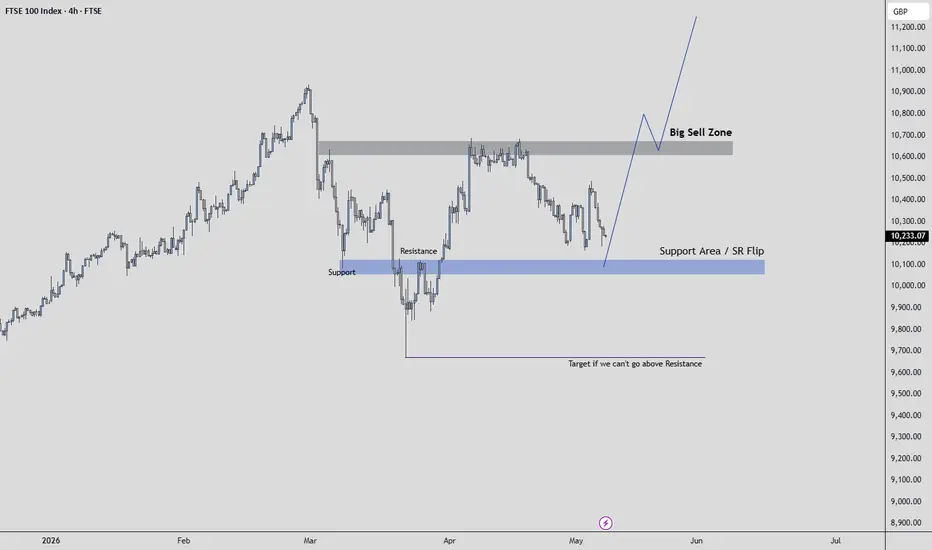
• Support / SR Flip Zone:
The index is holding above a key structural zone around $10,100. This level previously acted as resistance and has now flipped into support.
• Big Sell Zone (Supply Cluster):
A major institutional supply area sits between $10,600 and $10,700. This zone represents prior distribution and is expected to act as strong resistance.
• Execution Logic:
Long positions are only structurally valid after a confirmed breakout and successful retest above the $10,600–$10,700 resistance zone. Premature entries carry high rejection risk.
• Bearish Trigger:
A 4H close below $10,100 invalidates the bullish structure and opens a move toward $9,670 liquidity.
---
D) EASY-TO-UNDERSTAND RELATION: THE "GLASS CEILING"
The market is currently in a structurally compressed range:
The floor at $10,100 is acting as strong support, while the resistance zone around $10,650 behaves like a glass ceiling.
Liquidity can push the market upward, but without a breakout through resistance, price remains capped. If support breaks instead, price accelerates downward toward the next liquidity zone at $9,670.
---
E) INVALIDATION & RISKS
• Macro Invalidation:
A surprise increase in UK Core CPI would force a more hawkish BoE stance, increasing downside pressure and risking a break of $10,100 support.
• Structural Risk:
The current movement appears partially driven by short-covering rather than sustained liquidity expansion, making confirmation at resistance critical for continuation.
The FTSE 100 is currently navigating a complex global liquidity environment as we approach mid-May 2026:
• BoE Policy & Inflation:
While the Fed has signaled a hawkish pause, the Bank of England (BoE) is facing a stickier inflation profile, with CPI near 3.4% YoY. This keeps yields elevated and limits the expansionary “cheap money” tailwind for UK equities.
• DXY & GBP/USD:
The U.S. Dollar Index (DXY) remains pressured below 98.00. However, relative GBP strength acts as a headwind for FTSE multinational exporters, as overseas earnings convert less favorably into sterling.
• Global Liquidity (M2 / TGA):
Global liquidity remains in a controlled expansion phase. The US Treasury General Account (TGA) around $860B indicates no active liquidity drain, providing a stable macro floor for risk assets.
---
B) RISK & INFLATION REGIME (Tier 1 & 3)
• Commodity Influence:
The FTSE 100 is heavily weighted toward energy and mining. With oil stabilizing after geopolitical volatility, the inflation-hedging component of the index is currently neutral.
• VIX Context:
With the VIX at 17.19, risk appetite remains cautiously constructive. However, proximity to key resistance increases the probability of localized volatility expansion.
---
C) TECHNICAL & ORDER FLOW STRUCTURE
• Support / SR Flip Zone:
The index is holding above a key structural zone around $10,100. This level previously acted as resistance and has now flipped into support.
• Big Sell Zone (Supply Cluster):
A major institutional supply area sits between $10,600 and $10,700. This zone represents prior distribution and is expected to act as strong resistance.
• Execution Logic:
Long positions are only structurally valid after a confirmed breakout and successful retest above the $10,600–$10,700 resistance zone. Premature entries carry high rejection risk.
• Bearish Trigger:
A 4H close below $10,100 invalidates the bullish structure and opens a move toward $9,670 liquidity.
---
D) EASY-TO-UNDERSTAND RELATION: THE "GLASS CEILING"
The market is currently in a structurally compressed range:
The floor at $10,100 is acting as strong support, while the resistance zone around $10,650 behaves like a glass ceiling.
Liquidity can push the market upward, but without a breakout through resistance, price remains capped. If support breaks instead, price accelerates downward toward the next liquidity zone at $9,670.
---
E) INVALIDATION & RISKS
• Macro Invalidation:
A surprise increase in UK Core CPI would force a more hawkish BoE stance, increasing downside pressure and risking a break of $10,100 support.
• Structural Risk:
The current movement appears partially driven by short-covering rather than sustained liquidity expansion, making confirmation at resistance critical for continuation.

การนำเสนอที่เกี่ยวข้อง
คำจำกัดสิทธิ์ความรับผิดชอบ
ข้อมูลและบทความไม่ได้มีวัตถุประสงค์เพื่อก่อให้เกิดกิจกรรมทางการเงิน, การลงทุน, การซื้อขาย, ข้อเสนอแนะ หรือคำแนะนำประเภทอื่น ๆ ที่ให้หรือรับรองโดย TradingView อ่านเพิ่มเติมใน ข้อกำหนดการใช้งาน
การนำเสนอที่เกี่ยวข้อง
คำจำกัดสิทธิ์ความรับผิดชอบ
ข้อมูลและบทความไม่ได้มีวัตถุประสงค์เพื่อก่อให้เกิดกิจกรรมทางการเงิน, การลงทุน, การซื้อขาย, ข้อเสนอแนะ หรือคำแนะนำประเภทอื่น ๆ ที่ให้หรือรับรองโดย TradingView อ่านเพิ่มเติมใน ข้อกำหนดการใช้งาน