
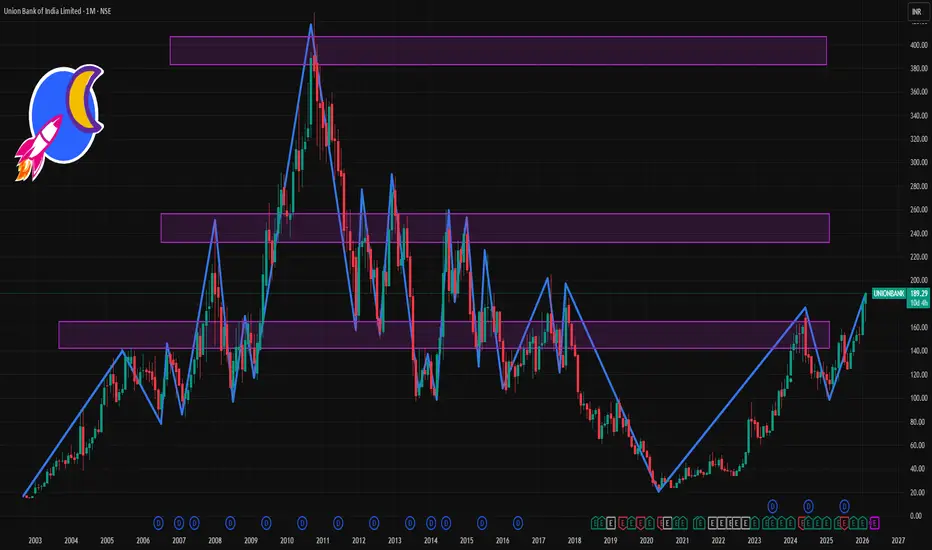
📊 Current Price Snapshot
Approximate live price: ~₹182 – ₹187 per share today.
52-week range: ~₹106 (low) — ₹189 (high).
Recent trend over the last 1 month shows a positive move with gains around +9 % (1-M return).
📈 1-Month Key Technical Levels
🛑 Resistance (Upside)
Levels where price could slow down or face selling pressure:
₹188 – ₹190 – near recent highs/52-week peak zone (major resistance).
₹185 – ₹187 – near short-term resistance cluster around current prices.
₹192 + – psychological/round-number resistance above recent swing highs. (round number)
Interpretation: A clean daily close above ~₹190 could indicate further upside continuation.
🟩 Support (Downside)
Zones where price may find buying support on pullbacks:
₹178 – ₹179 – immediate 1-month support around pivot/near intraday lows.
₹175 – ₹176 – secondary support where short-term buyers step in.
₹170 – ₹172 – deeper support aligned with multi-week retracement consolidation.
Interpretation: If price dips below ₹178 and fails to reclaim it, deeper correction towards ₹170 is possible.
📌 What This Means (1-Month View)
📉 Bullish Signs
Price trading near 52-week highs with generally positive momentum over 30 days.
1-month performance strong, suggesting accumulation.
📉 Risk / Pullback Levels
Breakdown below ₹175 – ₹172 zone increases risk of corrective sell-offs.
Strong support zone remains between ₹170 – ₹172.

Contact Knowledgehub for a detailed consultation: Dm on WhatsApp: [wa.link/a2o0kz]-
Phone No: [+91 93102 26243]-
Email: [tradingviewknowledgehub@gmail.com]---
-- Let’s achieve success together!
Phone No: [+91 93102 26243]-
Email: [tradingviewknowledgehub@gmail.com]---
-- Let’s achieve success together!
การนำเสนอที่เกี่ยวข้อง
คำจำกัดสิทธิ์ความรับผิดชอบ
ข้อมูลและบทความไม่ได้มีวัตถุประสงค์เพื่อก่อให้เกิดกิจกรรมทางการเงิน, การลงทุน, การซื้อขาย, ข้อเสนอแนะ หรือคำแนะนำประเภทอื่น ๆ ที่ให้หรือรับรองโดย TradingView อ่านเพิ่มเติมใน ข้อกำหนดการใช้งาน