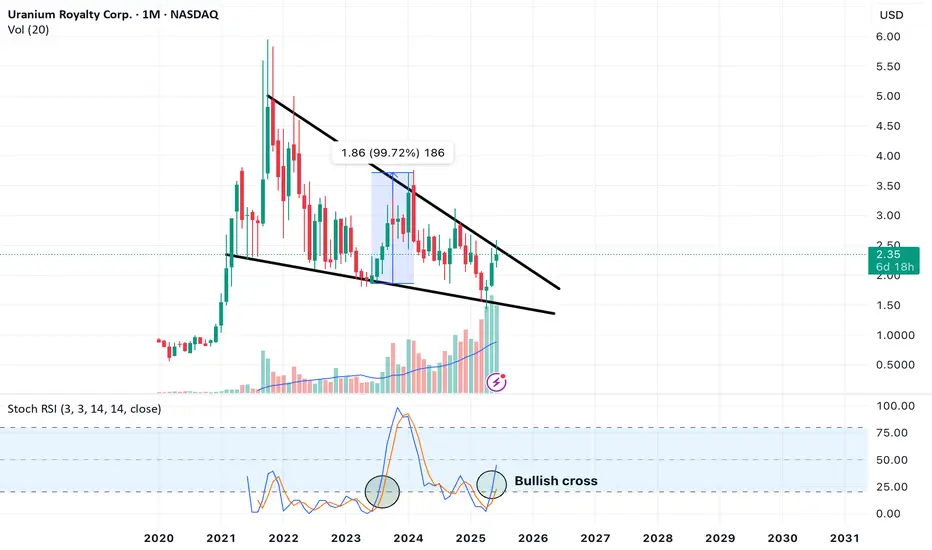
This is a look into the macro developments happening currently in UROY.
This is strictly a TA look into the big picture. We zoom out to Timeframes bigger than 1W.
At times zooming in to check (3 Day, 5 Day, maybe 1D) for potential swing trades.
I tend to look into things like price action, indicators, volume and other data to sway probabilities of where an asset may go and determine best opportunities of supply and demand zones based on my interpretations.
So jumping right in this is a look into price action on the 1 Month timeframe.
Looks to me like a massive macro falling wedge.
But theres massive volume. So thats a little contradicting.
In anycase always look for confirmation of breakouts.
On another negative note: this is only 5 years of data. Would have loved more price data.
Also note potential bullish cross of STOCH RSI, a momentum indicator. Still need confirmation though. If blue and orange line above 20 level on STOCH at monthly candle close.
COuld be a positive.
But key is to watch for confluence of many signs and or indicators.
I will be keeping my eyes on this.
Look for more posts as things develop on UROY.
DISCLAIMER: This is not financial advice, i am not a financial advisor. The thoughts expressed in the posts are my opinion and for educational purposes. Do not use my ideas for the basis of your trading strategy, make sure to work out your own strategy and when trading always spend majority of your time on risk management strategy.
This is strictly a TA look into the big picture. We zoom out to Timeframes bigger than 1W.
At times zooming in to check (3 Day, 5 Day, maybe 1D) for potential swing trades.
I tend to look into things like price action, indicators, volume and other data to sway probabilities of where an asset may go and determine best opportunities of supply and demand zones based on my interpretations.
So jumping right in this is a look into price action on the 1 Month timeframe.
Looks to me like a massive macro falling wedge.
But theres massive volume. So thats a little contradicting.
In anycase always look for confirmation of breakouts.
On another negative note: this is only 5 years of data. Would have loved more price data.
Also note potential bullish cross of STOCH RSI, a momentum indicator. Still need confirmation though. If blue and orange line above 20 level on STOCH at monthly candle close.
COuld be a positive.
But key is to watch for confluence of many signs and or indicators.
I will be keeping my eyes on this.
Look for more posts as things develop on UROY.
DISCLAIMER: This is not financial advice, i am not a financial advisor. The thoughts expressed in the posts are my opinion and for educational purposes. Do not use my ideas for the basis of your trading strategy, make sure to work out your own strategy and when trading always spend majority of your time on risk management strategy.
การซื้อขายยังคงดำเนินอยู่
Price action is currently breaking out of the macro falling wedge.
I would watch on the lower timeframes a test of Support at the breakout zone or the Upper trend line used to create upper part of the wedge pattern. This can be an area for entry of trades, with stop loss below the mentioned upper trend line.
Being that we breaking out on 1 month timeframe, we have alot more upside to come in my opinion.
BUT also remember trade confirmations. Always trade confirmations! Doesnt have to be on the 1 Month though. Just a thought.
ปิดการเทรด: ถึงเป้าหมายการทำกำไร
One the 1 day timeframe.
We got a gap that will most likely fill.
We also have a huge upper wick indicating sell pressure.
Im expecting the touch of this short term support area indicated by candles and that lower wick.
บันทึก
Well, well. Looks like i was on the money. Area to continue to observe and wait for shorter term timeframe indicators to flip to oversold. Notice Stoch RSI crossing bearish.
Remember this is on the 1 day. But i still strongly believe UROY has larger macro upside coming.
บันทึก
I would watch the Resistance trendline, now looking like Support trendline. We could still potentially come back again to touch and test as this Trendline was some serious Resistance for some time.
And the the Massive upper wick on the previous months candle indicates profit taking. Current monthly candle indicating indecision atm but we still got a long way to go.
And ofcourse if we print higher high and higher lows. Supports the incoming macro uptrend picture.
Keep an eye out if your looking to trade this. Stop Loss can be put below the Major Resistance now Support line.

การนำเสนอที่เกี่ยวข้อง
คำจำกัดสิทธิ์ความรับผิดชอบ
ข้อมูลและบทความไม่ได้มีวัตถุประสงค์เพื่อก่อให้เกิดกิจกรรมทางการเงิน, การลงทุน, การซื้อขาย, ข้อเสนอแนะ หรือคำแนะนำประเภทอื่น ๆ ที่ให้หรือรับรองโดย TradingView อ่านเพิ่มเติมใน ข้อกำหนดการใช้งาน
การนำเสนอที่เกี่ยวข้อง
คำจำกัดสิทธิ์ความรับผิดชอบ
ข้อมูลและบทความไม่ได้มีวัตถุประสงค์เพื่อก่อให้เกิดกิจกรรมทางการเงิน, การลงทุน, การซื้อขาย, ข้อเสนอแนะ หรือคำแนะนำประเภทอื่น ๆ ที่ให้หรือรับรองโดย TradingView อ่านเพิ่มเติมใน ข้อกำหนดการใช้งาน