
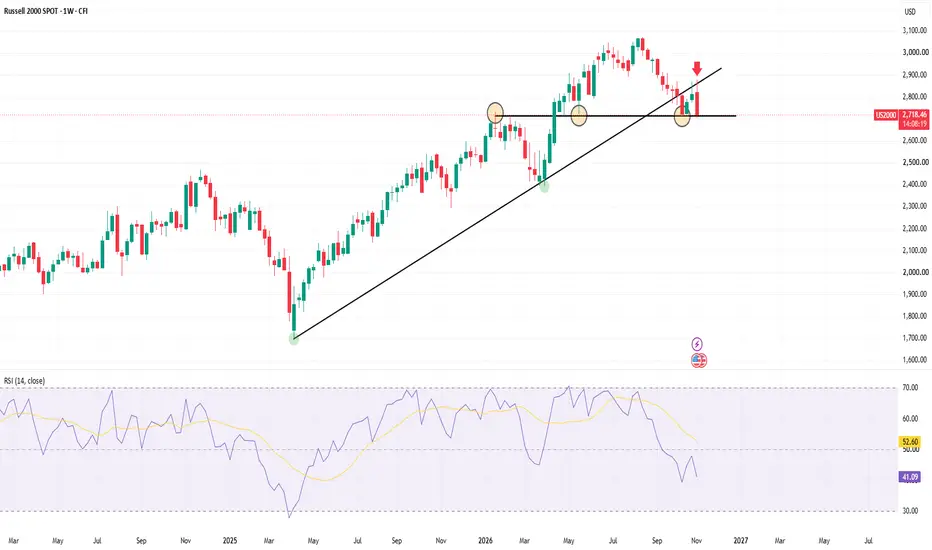
Technical analysis of the US2000 index:
The Russell US2000 Index is currently trading near key support levels, and we will be watching how prices react to this area. The index recorded a sharp decline in yesterday's session, falling by 5.1% and settling near the 2,715 level. The support levels in question are located around 2,720. The technical significance of these levels can be summarized in the following key points:
In conclusion, prices are trading near a key support zone, and their reaction to this area will have a clear impact on the market's direction.
Fundamental analysis of the US2000 index:
The Russell US2000 Index is currently trading near key support levels, and we will be watching how prices react to this area. The index recorded a sharp decline in yesterday's session, falling by 5.1% and settling near the 2,715 level. The support levels in question are located around 2,720. The technical significance of these levels can be summarized in the following key points:
- This area previously acted as a resistance zone at the beginning of the current year before turning into a support zone, from which prices rebounded on two previous occasions.
- A break below these levels would complete a bearish Head and Shoulders pattern, as illustrated in the attached chart.
- As can also be observed in the attached chart, prices have broken below the support of an ascending trendline and the 50-week moving average.
In conclusion, prices are trading near a key support zone, and their reaction to this area will have a clear impact on the market's direction.
Fundamental analysis of the US2000 index:
- US stocks suffered significant losses in yesterday's Thursday session, with their market value declining by more than $3 trillion. This marked one of the steepest losses in the past 30 years. Investors linked the decline to concerns that a Democratic victory in the congressional elections could slow the AI boom, reduce spending, and lead to increased scrutiny and investigations.
- Yesterday's market action demonstrated that betting on the strength of a single sector, in this case, the technology sector, is neither a sound nor a reliable strategy. Any shock affecting this sector is likely to be followed by weakness across other sectors. There is a clear and well-established principle in the world of financial markets: "The averages must confirm each other."
- In addition to all the above, doubts surrounding the negotiations, concerns about potential disruptions to oil supplies, and continued uncertainty have further heightened market concerns.

คำจำกัดสิทธิ์ความรับผิดชอบ
ข้อมูลและบทความไม่ได้มีวัตถุประสงค์เพื่อก่อให้เกิดกิจกรรมทางการเงิน, การลงทุน, การซื้อขาย, ข้อเสนอแนะ หรือคำแนะนำประเภทอื่น ๆ ที่ให้หรือรับรองโดย TradingView อ่านเพิ่มเติมใน ข้อกำหนดการใช้งาน
คำจำกัดสิทธิ์ความรับผิดชอบ
ข้อมูลและบทความไม่ได้มีวัตถุประสงค์เพื่อก่อให้เกิดกิจกรรมทางการเงิน, การลงทุน, การซื้อขาย, ข้อเสนอแนะ หรือคำแนะนำประเภทอื่น ๆ ที่ให้หรือรับรองโดย TradingView อ่านเพิ่มเติมใน ข้อกำหนดการใช้งาน