
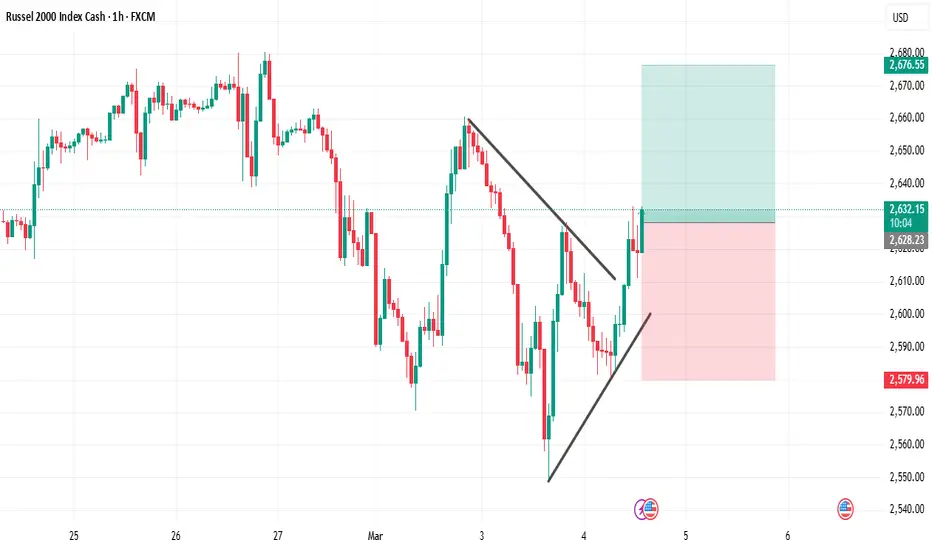
The Russell 2000 formed a symmetrical triangle after a strong sell-off, showing a period of compression where volatility started to decrease. These structures often precede a momentum expansion once price breaks out of the pattern.
Price has now broken above the triangle resistance, suggesting that short-term momentum could shift to the upside.
Entry 2628
Stop Loss 2579
TP 2676
Price has now broken above the triangle resistance, suggesting that short-term momentum could shift to the upside.
Entry 2628
Stop Loss 2579
TP 2676
ปิดการเทรด: ถึงเป้าหมายการตัดขาดทุน
Trade did not catch enough momentum. Trading plan respected
คำจำกัดสิทธิ์ความรับผิดชอบ
ข้อมูลและบทความไม่ได้มีวัตถุประสงค์เพื่อก่อให้เกิดกิจกรรมทางการเงิน, การลงทุน, การซื้อขาย, ข้อเสนอแนะ หรือคำแนะนำประเภทอื่น ๆ ที่ให้หรือรับรองโดย TradingView อ่านเพิ่มเติมใน ข้อกำหนดการใช้งาน
คำจำกัดสิทธิ์ความรับผิดชอบ
ข้อมูลและบทความไม่ได้มีวัตถุประสงค์เพื่อก่อให้เกิดกิจกรรมทางการเงิน, การลงทุน, การซื้อขาย, ข้อเสนอแนะ หรือคำแนะนำประเภทอื่น ๆ ที่ให้หรือรับรองโดย TradingView อ่านเพิ่มเติมใน ข้อกำหนดการใช้งาน