

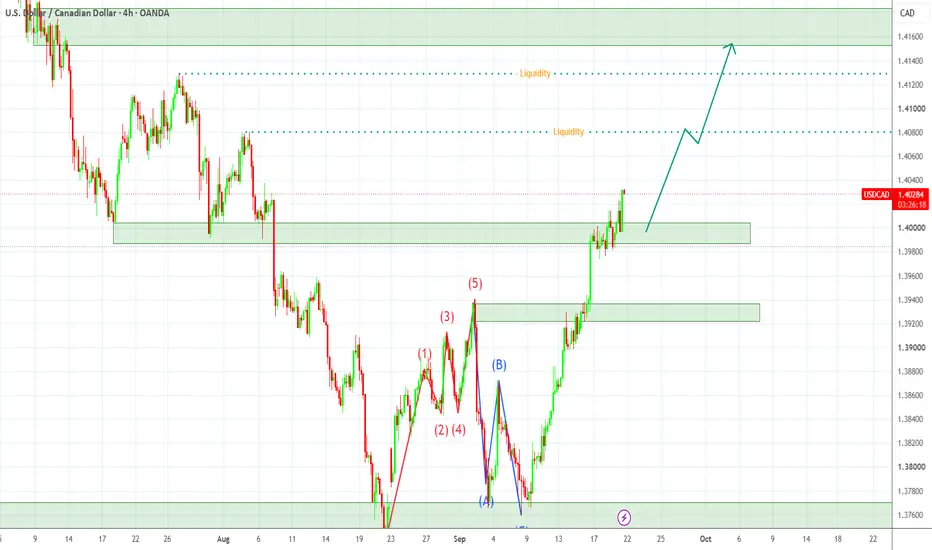
USD/CAD — 4H Market Structure 📊
USD/CAD is showing a strong recovery from the 1.3750–1.3780 demand zone and has now pushed back above the 1.4000 area. Price is currently around 1.4028, with bullish momentum becoming more visible on the 4H structure.
The immediate zone to watch is 1.3980–1.4010. If this area holds as support, the chart suggests potential continuation toward the liquidity levels around 1.4080 and 1.4130, followed by the larger 1.4150–1.4170 supply zone.
However, price is approaching previous highs, so confirmation is important. A sustained move back below 1.3980 would weaken the immediate bullish structure and could bring 1.3920–1.3940 back into focus.
Current map:
1.3980–1.4010 support → 1.4080 liquidity → 1.4130 liquidity → 1.4150–1.4170
🗓️ Forex Calendar — USD/CAD
This week the main CAD catalyst is Canadian Retail Sales on Thursday, 24 September, while the U.S. calendar has Initial Jobless Claims, Current Account and New Home Sales on the same day. Friday brings U.S. Durable Goods Orders and Michigan Consumer Sentiment.
For USD/CAD, I'll be watching the data reaction around the 1.4000 support area. Stronger Canadian data could pressure USD/CAD, while stronger U.S. data or weaker Canadian numbers could support continuation higher.
For now: bullish structure remains intact above 1.3980, but the next major test is the 1.4080 liquidity area.
*Not financial advice — educational/market-structure analysis only.*
USD/CAD is showing a strong recovery from the 1.3750–1.3780 demand zone and has now pushed back above the 1.4000 area. Price is currently around 1.4028, with bullish momentum becoming more visible on the 4H structure.
The immediate zone to watch is 1.3980–1.4010. If this area holds as support, the chart suggests potential continuation toward the liquidity levels around 1.4080 and 1.4130, followed by the larger 1.4150–1.4170 supply zone.
However, price is approaching previous highs, so confirmation is important. A sustained move back below 1.3980 would weaken the immediate bullish structure and could bring 1.3920–1.3940 back into focus.
Current map:
1.3980–1.4010 support → 1.4080 liquidity → 1.4130 liquidity → 1.4150–1.4170
🗓️ Forex Calendar — USD/CAD
This week the main CAD catalyst is Canadian Retail Sales on Thursday, 24 September, while the U.S. calendar has Initial Jobless Claims, Current Account and New Home Sales on the same day. Friday brings U.S. Durable Goods Orders and Michigan Consumer Sentiment.
For USD/CAD, I'll be watching the data reaction around the 1.4000 support area. Stronger Canadian data could pressure USD/CAD, while stronger U.S. data or weaker Canadian numbers could support continuation higher.
For now: bullish structure remains intact above 1.3980, but the next major test is the 1.4080 liquidity area.
*Not financial advice — educational/market-structure analysis only.*
ปิดการเทรด: ถึงเป้าหมายการทำกำไร

คำจำกัดสิทธิ์ความรับผิดชอบ
ข้อมูลและบทความไม่ได้มีวัตถุประสงค์เพื่อก่อให้เกิดกิจกรรมทางการเงิน, การลงทุน, การซื้อขาย, ข้อเสนอแนะ หรือคำแนะนำประเภทอื่น ๆ ที่ให้หรือรับรองโดย TradingView อ่านเพิ่มเติมใน ข้อกำหนดการใช้งาน
คำจำกัดสิทธิ์ความรับผิดชอบ
ข้อมูลและบทความไม่ได้มีวัตถุประสงค์เพื่อก่อให้เกิดกิจกรรมทางการเงิน, การลงทุน, การซื้อขาย, ข้อเสนอแนะ หรือคำแนะนำประเภทอื่น ๆ ที่ให้หรือรับรองโดย TradingView อ่านเพิ่มเติมใน ข้อกำหนดการใช้งาน