

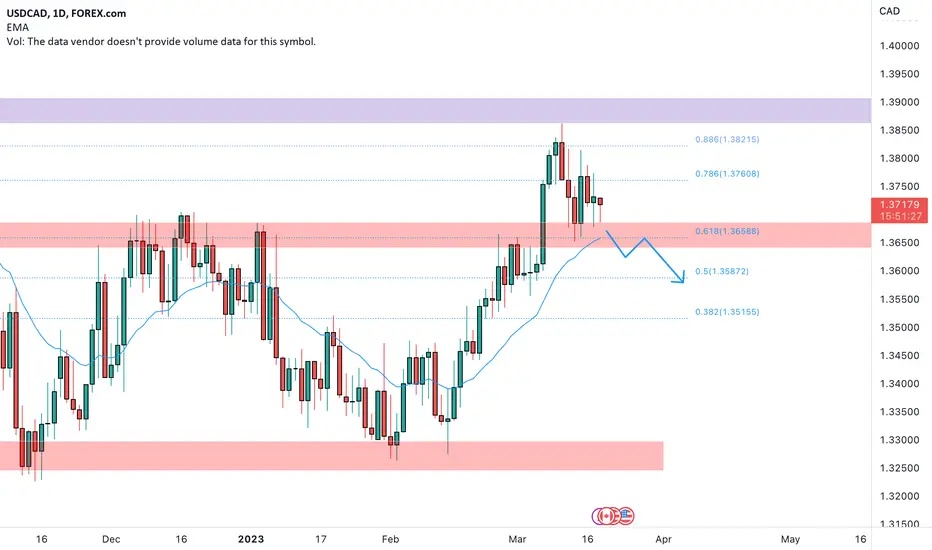
USDCAD on the 1D chart has traded at the recent high.
The price after testing the weekly support at the 1.33 level started an impulse that drive the pair to a new test of the monthly resistance with a spike.
We can notice how the market turned at the 0.886 Fibonacci retracement from the previous recent high to the 1.33 level.
How can i approach this scenario?
I will wait for a potential break of the support area and IF that will happen i will move on the 4h chart to look for a possible short order according to the Plancton's strategy rules.
The price after testing the weekly support at the 1.33 level started an impulse that drive the pair to a new test of the monthly resistance with a spike.
We can notice how the market turned at the 0.886 Fibonacci retracement from the previous recent high to the 1.33 level.
How can i approach this scenario?
I will wait for a potential break of the support area and IF that will happen i will move on the 4h chart to look for a possible short order according to the Plancton's strategy rules.
บันทึก
บันทึก
บันทึก
บันทึก
บันทึก
บันทึก
บันทึก
บันทึก

คำจำกัดสิทธิ์ความรับผิดชอบ
ข้อมูลและบทความไม่ได้มีวัตถุประสงค์เพื่อก่อให้เกิดกิจกรรมทางการเงิน, การลงทุน, การซื้อขาย, ข้อเสนอแนะ หรือคำแนะนำประเภทอื่น ๆ ที่ให้หรือรับรองโดย TradingView อ่านเพิ่มเติมใน ข้อกำหนดการใช้งาน
คำจำกัดสิทธิ์ความรับผิดชอบ
ข้อมูลและบทความไม่ได้มีวัตถุประสงค์เพื่อก่อให้เกิดกิจกรรมทางการเงิน, การลงทุน, การซื้อขาย, ข้อเสนอแนะ หรือคำแนะนำประเภทอื่น ๆ ที่ให้หรือรับรองโดย TradingView อ่านเพิ่มเติมใน ข้อกำหนดการใช้งาน