

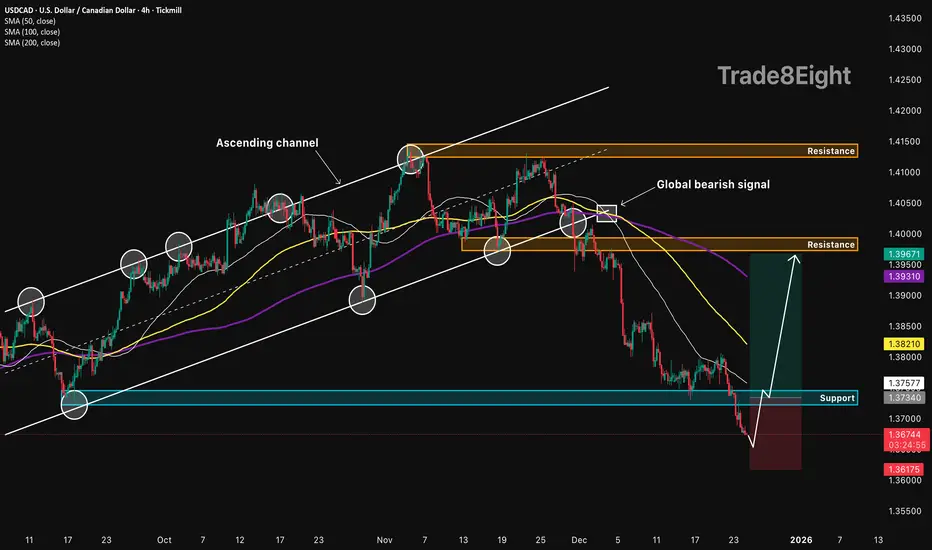
🛠 Technical Analysis: On the 4-hour (H4) timeframe, USDCAD has undergone a significant bearish correction following a breakdown from its long-term Ascending channel. A "Global bearish signal" was confirmed in early December, leading to a sharp drop that pushed the price below all major moving averages (SMA 50, 100, and 200).
Currently, the pair is trading near the support at 1.37300. The price action suggests a "v-shaped" recovery attempt as the downward momentum slows down near this multi-month low. The analysis anticipates a technical reversal (mean reversion) back toward the previous breakout zone and the SMA 50, SMA 100 cluster, targeting the resistance around 1.39500.
———————————————
❗️Trade Parameters (BUY)
———————————————
➡️ Entry Point: Buy only after the price closes above the support of 1.37300 (approx. 1.37340).
🎯 Take Profit: 1.39500 (Resistance).
🔴 Stop Loss: 1.36175 (Below the most recent swing low).
⚠️ Disclaimer: This is a potential trade idea based on current analysis; market conditions and price direction are subject to change based on news factors and volatility.
Currently, the pair is trading near the support at 1.37300. The price action suggests a "v-shaped" recovery attempt as the downward momentum slows down near this multi-month low. The analysis anticipates a technical reversal (mean reversion) back toward the previous breakout zone and the SMA 50, SMA 100 cluster, targeting the resistance around 1.39500.
———————————————
❗️Trade Parameters (BUY)
———————————————
➡️ Entry Point: Buy only after the price closes above the support of 1.37300 (approx. 1.37340).
🎯 Take Profit: 1.39500 (Resistance).
🔴 Stop Loss: 1.36175 (Below the most recent swing low).
⚠️ Disclaimer: This is a potential trade idea based on current analysis; market conditions and price direction are subject to change based on news factors and volatility.
บันทึก
🌍 Fundamental Analysis: As of Christmas Eve, December 24, market liquidity is significantly reduced. This "thin" market environment often triggers sharp technical bounces as institutional traders square off their short positions for the year-end. The Canadian Dollar's strength, which drove the recent decline, may face headwinds if oil prices stabilize or if the US Dollar sees a holiday safe-haven bid. This setup relies on the technical exhaustion of the recent bearish trend and a year-end rebalancing move back toward the 1.3900 handle.การซื้อขายยังคงดำเนินอยู่
ปิดการเทรด ด้วยตนเอง

⚠️ Public market view only. Not financial advice. DYOR and manage your own risk.
การนำเสนอที่เกี่ยวข้อง
คำจำกัดสิทธิ์ความรับผิดชอบ
ข้อมูลและบทความไม่ได้มีวัตถุประสงค์เพื่อก่อให้เกิดกิจกรรมทางการเงิน, การลงทุน, การซื้อขาย, ข้อเสนอแนะ หรือคำแนะนำประเภทอื่น ๆ ที่ให้หรือรับรองโดย TradingView อ่านเพิ่มเติมใน ข้อกำหนดการใช้งาน
⚠️ Public market view only. Not financial advice. DYOR and manage your own risk.
การนำเสนอที่เกี่ยวข้อง
คำจำกัดสิทธิ์ความรับผิดชอบ
ข้อมูลและบทความไม่ได้มีวัตถุประสงค์เพื่อก่อให้เกิดกิจกรรมทางการเงิน, การลงทุน, การซื้อขาย, ข้อเสนอแนะ หรือคำแนะนำประเภทอื่น ๆ ที่ให้หรือรับรองโดย TradingView อ่านเพิ่มเติมใน ข้อกำหนดการใช้งาน