

🔎 Technical Breakdown
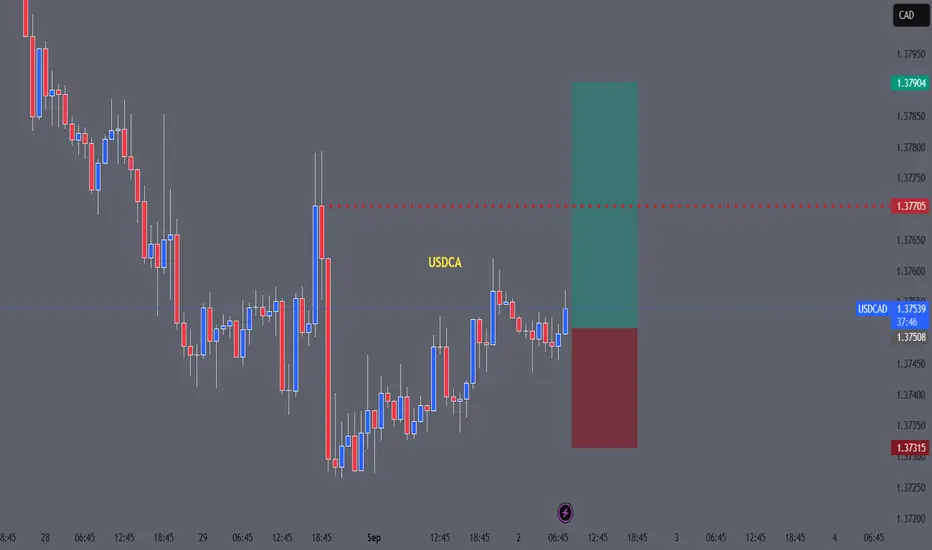
Breakout Structure
Price had been consolidating in a sideways range after a strong downtrend.
Recently, price broke out of the consolidation zone to the upside, showing buyers stepping in.
Current candles are forming higher lows → early trend reversal signals.
Support Zone (Demand Area)
Around 1.3730–1.3740, price rejected multiple times (wicks).
This shows strong demand, making it a safe stop-loss zone.
Candle Behavior
Recent bullish candles have longer bodies and smaller wicks → momentum favors buyers.
The last red candles got quickly engulfed by blue (bullish) candles → market bias shifted.
Risk-to-Reward (RRR)
SL around 1.3731 and TP1 at 1.3770 / TP2 1.3790 gives you nearly a 1:2 RRR, which is favorable.
Market Context
USDCAD often reacts strongly to oil price moves and USD strength. If USD is stable/strong, buying pressure supports this setup.
Also, this looks like a retracement entry after a sell-off, catching the early reversal
PS - STILL BEARISH IN DAILY TF
Breakout Structure
Price had been consolidating in a sideways range after a strong downtrend.
Recently, price broke out of the consolidation zone to the upside, showing buyers stepping in.
Current candles are forming higher lows → early trend reversal signals.
Support Zone (Demand Area)
Around 1.3730–1.3740, price rejected multiple times (wicks).
This shows strong demand, making it a safe stop-loss zone.
Candle Behavior
Recent bullish candles have longer bodies and smaller wicks → momentum favors buyers.
The last red candles got quickly engulfed by blue (bullish) candles → market bias shifted.
Risk-to-Reward (RRR)
SL around 1.3731 and TP1 at 1.3770 / TP2 1.3790 gives you nearly a 1:2 RRR, which is favorable.
Market Context
USDCAD often reacts strongly to oil price moves and USD strength. If USD is stable/strong, buying pressure supports this setup.
Also, this looks like a retracement entry after a sell-off, catching the early reversal
PS - STILL BEARISH IN DAILY TF

คำจำกัดสิทธิ์ความรับผิดชอบ
ข้อมูลและบทความไม่ได้มีวัตถุประสงค์เพื่อก่อให้เกิดกิจกรรมทางการเงิน, การลงทุน, การซื้อขาย, ข้อเสนอแนะ หรือคำแนะนำประเภทอื่น ๆ ที่ให้หรือรับรองโดย TradingView อ่านเพิ่มเติมใน ข้อกำหนดการใช้งาน
คำจำกัดสิทธิ์ความรับผิดชอบ
ข้อมูลและบทความไม่ได้มีวัตถุประสงค์เพื่อก่อให้เกิดกิจกรรมทางการเงิน, การลงทุน, การซื้อขาย, ข้อเสนอแนะ หรือคำแนะนำประเภทอื่น ๆ ที่ให้หรือรับรองโดย TradingView อ่านเพิ่มเติมใน ข้อกำหนดการใช้งาน