

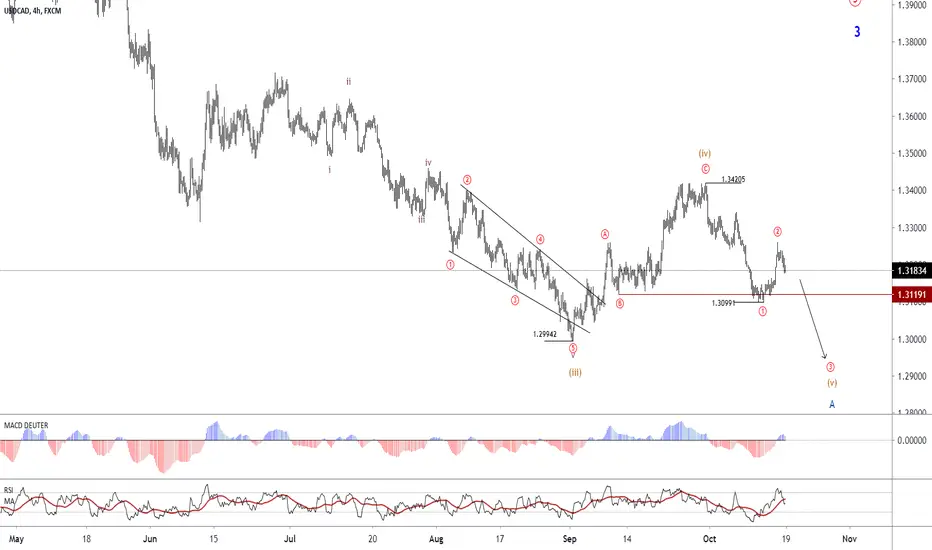
By the price crossing the 1.3099 range, the uptrend encountered some changes, which can be seen in the daily chart.
The overall structure is in the form of a Double Zigzag pattern (in the daily chart) and in the 240-minute chart, the price is completing the V wave from the point of A, which can be extended up to the targets of 1.2950. And in continuation, we enter the corrective (uptrend) to accomplish wave B.
The overall structure is in the form of a Double Zigzag pattern (in the daily chart) and in the 240-minute chart, the price is completing the V wave from the point of A, which can be extended up to the targets of 1.2950. And in continuation, we enter the corrective (uptrend) to accomplish wave B.

คำจำกัดสิทธิ์ความรับผิดชอบ
ข้อมูลและบทความไม่ได้มีวัตถุประสงค์เพื่อก่อให้เกิดกิจกรรมทางการเงิน, การลงทุน, การซื้อขาย, ข้อเสนอแนะ หรือคำแนะนำประเภทอื่น ๆ ที่ให้หรือรับรองโดย TradingView อ่านเพิ่มเติมใน ข้อกำหนดการใช้งาน
คำจำกัดสิทธิ์ความรับผิดชอบ
ข้อมูลและบทความไม่ได้มีวัตถุประสงค์เพื่อก่อให้เกิดกิจกรรมทางการเงิน, การลงทุน, การซื้อขาย, ข้อเสนอแนะ หรือคำแนะนำประเภทอื่น ๆ ที่ให้หรือรับรองโดย TradingView อ่านเพิ่มเติมใน ข้อกำหนดการใช้งาน