

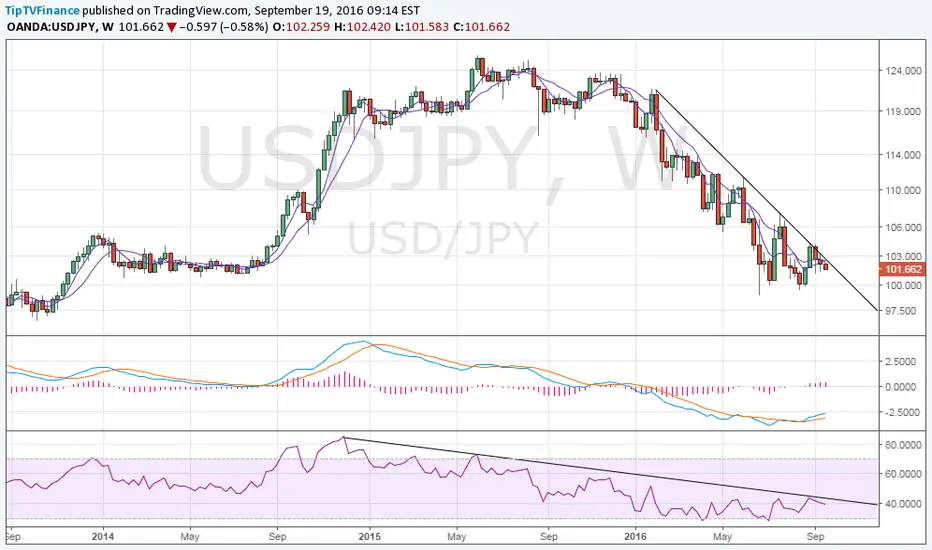
Weekly chart shows the descending trend line on the price chart and RSI is very much intact.
However, note the repeated rebound from near 99-100 levels and the bullish crossover between MACD lines.
Hence, the odds of the pair breaching the descending trendline are high and a much safer short trade would be below 100.00 levels.
However, note the repeated rebound from near 99-100 levels and the bullish crossover between MACD lines.
Hence, the odds of the pair breaching the descending trendline are high and a much safer short trade would be below 100.00 levels.

การนำเสนอที่เกี่ยวข้อง
คำจำกัดสิทธิ์ความรับผิดชอบ
ข้อมูลและบทความไม่ได้มีวัตถุประสงค์เพื่อก่อให้เกิดกิจกรรมทางการเงิน, การลงทุน, การซื้อขาย, ข้อเสนอแนะ หรือคำแนะนำประเภทอื่น ๆ ที่ให้หรือรับรองโดย TradingView อ่านเพิ่มเติมใน ข้อกำหนดการใช้งาน
การนำเสนอที่เกี่ยวข้อง
คำจำกัดสิทธิ์ความรับผิดชอบ
ข้อมูลและบทความไม่ได้มีวัตถุประสงค์เพื่อก่อให้เกิดกิจกรรมทางการเงิน, การลงทุน, การซื้อขาย, ข้อเสนอแนะ หรือคำแนะนำประเภทอื่น ๆ ที่ให้หรือรับรองโดย TradingView อ่านเพิ่มเติมใน ข้อกำหนดการใช้งาน