

Happy new week traders!
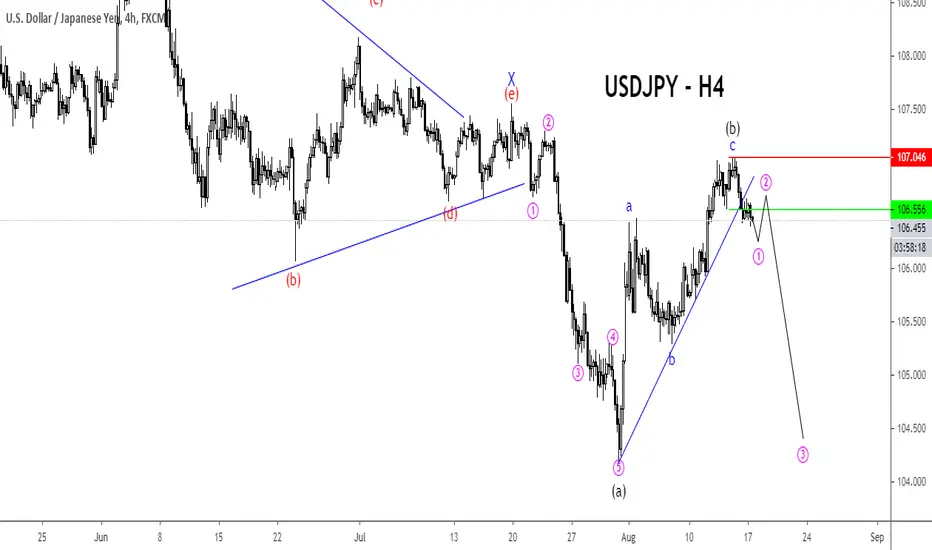
In the USDJPY 4 hourly chart above, price broke out of a triangle pattern and made a five-wave impulse decline in wave (a).
A three-wave corrective move that unfolded has a zigzag pattern follows the sell-off in wave (b).
According to Elliot Wave theory, once a 5-3 wave cycle is completed, the price resumes in the direction of the impulse wave.
In USDJPY case, if this count is correct we should see a massive decline that will take the low of wave (a) in the days ahead.
- Invalidation level is the red line on the chart
- Entry is the green line which has been triggered
Alternative Count: 1-2, (I)-(ii).
Good luck on the chart!
Veejahbee
In the USDJPY 4 hourly chart above, price broke out of a triangle pattern and made a five-wave impulse decline in wave (a).
A three-wave corrective move that unfolded has a zigzag pattern follows the sell-off in wave (b).
According to Elliot Wave theory, once a 5-3 wave cycle is completed, the price resumes in the direction of the impulse wave.
In USDJPY case, if this count is correct we should see a massive decline that will take the low of wave (a) in the days ahead.
- Invalidation level is the red line on the chart
- Entry is the green line which has been triggered
Alternative Count: 1-2, (I)-(ii).
Good luck on the chart!
Veejahbee

คำจำกัดสิทธิ์ความรับผิดชอบ
ข้อมูลและบทความไม่ได้มีวัตถุประสงค์เพื่อก่อให้เกิดกิจกรรมทางการเงิน, การลงทุน, การซื้อขาย, ข้อเสนอแนะ หรือคำแนะนำประเภทอื่น ๆ ที่ให้หรือรับรองโดย TradingView อ่านเพิ่มเติมใน ข้อกำหนดการใช้งาน
คำจำกัดสิทธิ์ความรับผิดชอบ
ข้อมูลและบทความไม่ได้มีวัตถุประสงค์เพื่อก่อให้เกิดกิจกรรมทางการเงิน, การลงทุน, การซื้อขาย, ข้อเสนอแนะ หรือคำแนะนำประเภทอื่น ๆ ที่ให้หรือรับรองโดย TradingView อ่านเพิ่มเติมใน ข้อกำหนดการใช้งาน