
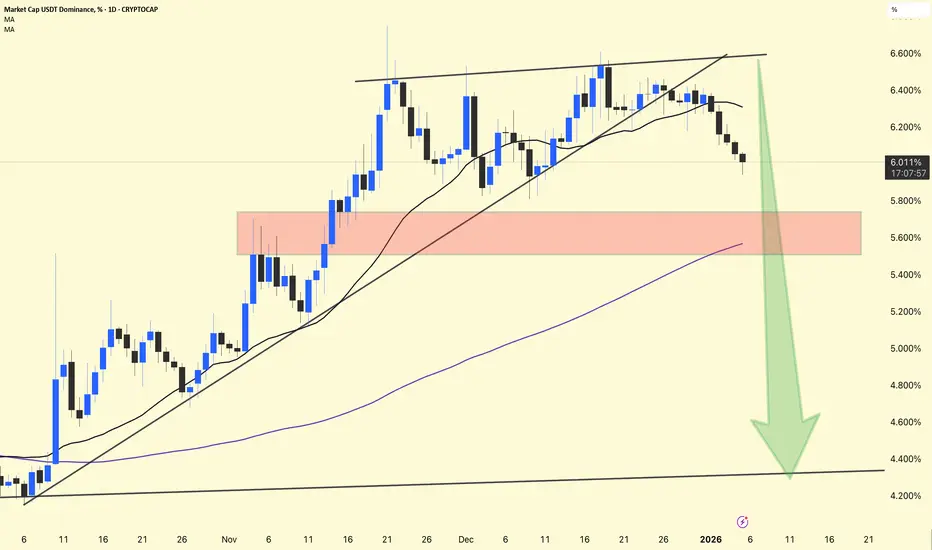
USDT Dominance (USDT.D)
USDT.D has broken below the rising trendline & short-term MAs, showing weakness in stablecoin dominance.
Current level: ~6.01%
5.6% – 5.8% (highlighted red zone)
This is a critical support. If it fails, downside may accelerate.
Downside Targets (if support breaks):
5.2%
4.8%
Major support near 4.3% – 4.4% (long-term trendline)
Falling USDT.D = money moving from stablecoins into crypto
Supports BTC & altcoin bullish continuation
Higher probability of altcoin momentum if the breakdown continues
USDT Dominance is bearish, favoring risk-on sentiment. As long as it stays below the broken trendline, bullish pressure on crypto remains intact.
USDT.D has broken below the rising trendline & short-term MAs, showing weakness in stablecoin dominance.
Current level: ~6.01%
5.6% – 5.8% (highlighted red zone)
This is a critical support. If it fails, downside may accelerate.
Downside Targets (if support breaks):
5.2%
4.8%
Major support near 4.3% – 4.4% (long-term trendline)
Falling USDT.D = money moving from stablecoins into crypto
Supports BTC & altcoin bullish continuation
Higher probability of altcoin momentum if the breakdown continues
USDT Dominance is bearish, favoring risk-on sentiment. As long as it stays below the broken trendline, bullish pressure on crypto remains intact.

การนำเสนอที่เกี่ยวข้อง
คำจำกัดสิทธิ์ความรับผิดชอบ
ข้อมูลและบทความไม่ได้มีวัตถุประสงค์เพื่อก่อให้เกิดกิจกรรมทางการเงิน, การลงทุน, การซื้อขาย, ข้อเสนอแนะ หรือคำแนะนำประเภทอื่น ๆ ที่ให้หรือรับรองโดย TradingView อ่านเพิ่มเติมใน ข้อกำหนดการใช้งาน
การนำเสนอที่เกี่ยวข้อง
คำจำกัดสิทธิ์ความรับผิดชอบ
ข้อมูลและบทความไม่ได้มีวัตถุประสงค์เพื่อก่อให้เกิดกิจกรรมทางการเงิน, การลงทุน, การซื้อขาย, ข้อเสนอแนะ หรือคำแนะนำประเภทอื่น ๆ ที่ให้หรือรับรองโดย TradingView อ่านเพิ่มเติมใน ข้อกำหนดการใช้งาน