

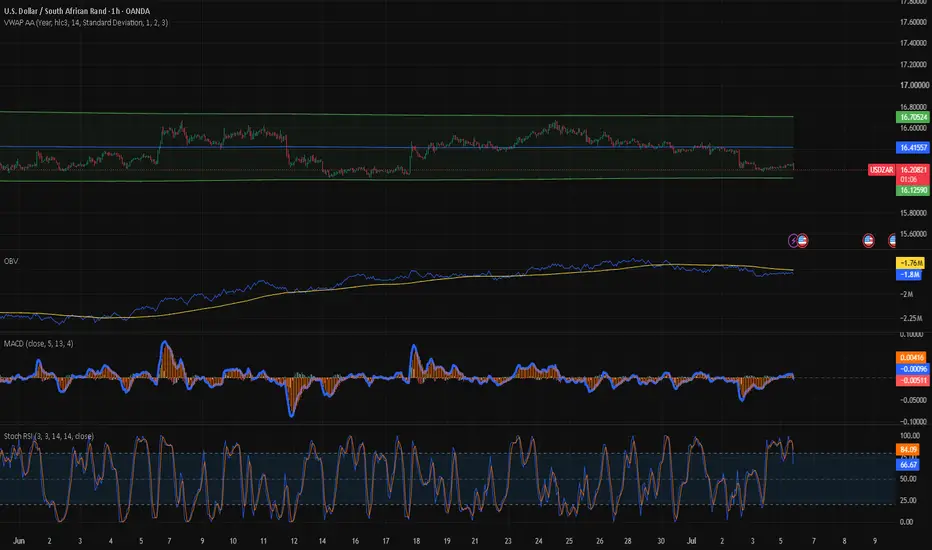
USDZAR starts the week near 16.25, sitting close to the lower edge of its recent trading range. The rand has benefited from a softer dollar, reduced expectations of near-term Federal Reserve tightening, and supportive performance in the South African bond market. Reuters reported that the dollar traded near two-week lows after weaker US jobs data reduced rate-hike expectations, while South Africa’s rand firmed into the end of last week on the same theme.
The week-ahead picture favours a controlled USDZAR range between 16.13 and 16.42, with a downside bias while price remains below the anchored VWAP midline around 16.41. The tactical risk is that USDZAR is stretched on the daily stochastic RSI, which makes the pair vulnerable to a corrective bounce before a cleaner move lower develops.
The Macro
The global driver remains the US dollar. June US payrolls rose by only 57,000, with downward revisions to prior months, reinforcing the view that the US labour market is cooling. That matters for USDZAR because weaker US data lowers the probability of additional Fed tightening and reduces pressure on high-carry emerging-market currencies.
South Africa’s domestic macro picture remains supportive for carry, although inflation has moved higher. Stats SA reported that CPI rose to 4.5% y/y in May, up from 4.0% in April, the highest level since July 2024. This keeps SARB policy restrictive and supports the rand’s yield advantage, but it also reduces the room for aggressive rate cuts.
Bond markets confirm that South Africa’s risk premium has compressed. 10-year yield at 8.365%, the 20-year at 8.920%, and the 30-year at 8.805%. The curve remains high-yielding, but the one-month performance shows meaningful declines across the long end, with the 10-year down about 4.01%, the 20-year down 5.11%, and the 30-year down 4.91%. This supports the rand through real-money demand for duration and improved sovereign risk perception. Trading Economics also noted the 10-year yield around the mid-8% area, close to recent lows, while inflation expectations remain an important watchpoint.
Technical Summary
The daily chart shows USDZAR within a broad, anchored VWAP band since the start of the year. Price is trading below the VWAP midline around 16.41, with the lower band near 16.14 and the upper band near 16.70. This structure defines the week’s trading map. Below 16.41, rallies look corrective. Near 16.13 to 16.18, exporters should expect stronger rand-profit-taking and importer demand.
The 4-hour chart shows USDZAR pressing into the lower VWAP band near 16.13 after rejecting the 16.60-16.70 area in late June. OBV has improved relative to its lows, but price has not followed higher, suggesting that buying interest lacks trend confirmation. MACD remains below the zero line but is turning upward, suggesting reduced bearish momentum rather than a confirmed bullish reversal.
The 1-hour chart is more tactical. Price is consolidating around 16.23 to 16.25, below the 1-hour VWAP midline at 16.42. Stochastic RSI is elevated, which limits the quality of fresh short-USD entries at current levels. A rebound into 16.32 to 16.41 would provide a cleaner level for exporters to increase hedge cover.
Forward Market and Treasury Implications
The forward curve remains heavily positive, reflecting South Africa’s interest-rate premium. Approximate midpoints are 453.8 points for 1M, 1215 points for 3M, 2400.7 points for 6M, and 4706 points for 12M. Using spot at 16.2497, this implies approximate outright levels of 16.70 for 1M, 17.46 for 3M, 18.65 for 6M, and 20.96 for 12M, depending on bank pricing and credit spreads.
For importers, the forward points are expensive, but spot is near the lower end of the recent range. This favours partial cover rather than full exposure. A practical approach would be to secure near-term USD needs on dips toward 16.18-16.13, while leaving some flexibility for a possible test of 16.00. Importers with low hedge ratios should treat a daily close above 16.42 as a signal to raise protection.
For exporters, current spot levels are less attractive for aggressive conversion. Exporters can use rebounds toward 16.35-16.42 to layer forward sales, especially where budget rates are below current forward outrights. A move toward 16.60 to 16.70 would represent a stronger hedge opportunity, as that zone aligns with the upper anchored VWAP area and recent supply.
Scenarios for the week ahead
The bullish ZAR case rests on continued dollar softness, stable risk sentiment, and further demand for South African bonds. In this case, USDZAR breaks the 16.13-16.18 support area and trades toward 16.00. This scenario gains credibility while US yields ease and the 10-year SAGB remains anchored near the mid-8% area.
The bearish ZAR case is a tactical USDZAR rebound. Daily momentum is stretched, and the pair is testing the lower VWAP band. A close back above 16.41 would shift the market toward 16.60 to 16.70, where exporters are likely to reappear. A move through 16.70 would signal that the recent rand-supportive bond-and-dollar dynamic is losing momentum.
The week-ahead picture favours a controlled USDZAR range between 16.13 and 16.42, with a downside bias while price remains below the anchored VWAP midline around 16.41. The tactical risk is that USDZAR is stretched on the daily stochastic RSI, which makes the pair vulnerable to a corrective bounce before a cleaner move lower develops.
The Macro
The global driver remains the US dollar. June US payrolls rose by only 57,000, with downward revisions to prior months, reinforcing the view that the US labour market is cooling. That matters for USDZAR because weaker US data lowers the probability of additional Fed tightening and reduces pressure on high-carry emerging-market currencies.
South Africa’s domestic macro picture remains supportive for carry, although inflation has moved higher. Stats SA reported that CPI rose to 4.5% y/y in May, up from 4.0% in April, the highest level since July 2024. This keeps SARB policy restrictive and supports the rand’s yield advantage, but it also reduces the room for aggressive rate cuts.
Bond markets confirm that South Africa’s risk premium has compressed. 10-year yield at 8.365%, the 20-year at 8.920%, and the 30-year at 8.805%. The curve remains high-yielding, but the one-month performance shows meaningful declines across the long end, with the 10-year down about 4.01%, the 20-year down 5.11%, and the 30-year down 4.91%. This supports the rand through real-money demand for duration and improved sovereign risk perception. Trading Economics also noted the 10-year yield around the mid-8% area, close to recent lows, while inflation expectations remain an important watchpoint.
Technical Summary
The daily chart shows USDZAR within a broad, anchored VWAP band since the start of the year. Price is trading below the VWAP midline around 16.41, with the lower band near 16.14 and the upper band near 16.70. This structure defines the week’s trading map. Below 16.41, rallies look corrective. Near 16.13 to 16.18, exporters should expect stronger rand-profit-taking and importer demand.
The 4-hour chart shows USDZAR pressing into the lower VWAP band near 16.13 after rejecting the 16.60-16.70 area in late June. OBV has improved relative to its lows, but price has not followed higher, suggesting that buying interest lacks trend confirmation. MACD remains below the zero line but is turning upward, suggesting reduced bearish momentum rather than a confirmed bullish reversal.
The 1-hour chart is more tactical. Price is consolidating around 16.23 to 16.25, below the 1-hour VWAP midline at 16.42. Stochastic RSI is elevated, which limits the quality of fresh short-USD entries at current levels. A rebound into 16.32 to 16.41 would provide a cleaner level for exporters to increase hedge cover.
Forward Market and Treasury Implications
The forward curve remains heavily positive, reflecting South Africa’s interest-rate premium. Approximate midpoints are 453.8 points for 1M, 1215 points for 3M, 2400.7 points for 6M, and 4706 points for 12M. Using spot at 16.2497, this implies approximate outright levels of 16.70 for 1M, 17.46 for 3M, 18.65 for 6M, and 20.96 for 12M, depending on bank pricing and credit spreads.
For importers, the forward points are expensive, but spot is near the lower end of the recent range. This favours partial cover rather than full exposure. A practical approach would be to secure near-term USD needs on dips toward 16.18-16.13, while leaving some flexibility for a possible test of 16.00. Importers with low hedge ratios should treat a daily close above 16.42 as a signal to raise protection.
For exporters, current spot levels are less attractive for aggressive conversion. Exporters can use rebounds toward 16.35-16.42 to layer forward sales, especially where budget rates are below current forward outrights. A move toward 16.60 to 16.70 would represent a stronger hedge opportunity, as that zone aligns with the upper anchored VWAP area and recent supply.
Scenarios for the week ahead
The bullish ZAR case rests on continued dollar softness, stable risk sentiment, and further demand for South African bonds. In this case, USDZAR breaks the 16.13-16.18 support area and trades toward 16.00. This scenario gains credibility while US yields ease and the 10-year SAGB remains anchored near the mid-8% area.
The bearish ZAR case is a tactical USDZAR rebound. Daily momentum is stretched, and the pair is testing the lower VWAP band. A close back above 16.41 would shift the market toward 16.60 to 16.70, where exporters are likely to reappear. A move through 16.70 would signal that the recent rand-supportive bond-and-dollar dynamic is losing momentum.

คำจำกัดสิทธิ์ความรับผิดชอบ
ข้อมูลและบทความไม่ได้มีวัตถุประสงค์เพื่อก่อให้เกิดกิจกรรมทางการเงิน, การลงทุน, การซื้อขาย, ข้อเสนอแนะ หรือคำแนะนำประเภทอื่น ๆ ที่ให้หรือรับรองโดย TradingView อ่านเพิ่มเติมใน ข้อกำหนดการใช้งาน
คำจำกัดสิทธิ์ความรับผิดชอบ
ข้อมูลและบทความไม่ได้มีวัตถุประสงค์เพื่อก่อให้เกิดกิจกรรมทางการเงิน, การลงทุน, การซื้อขาย, ข้อเสนอแนะ หรือคำแนะนำประเภทอื่น ๆ ที่ให้หรือรับรองโดย TradingView อ่านเพิ่มเติมใน ข้อกำหนดการใช้งาน