
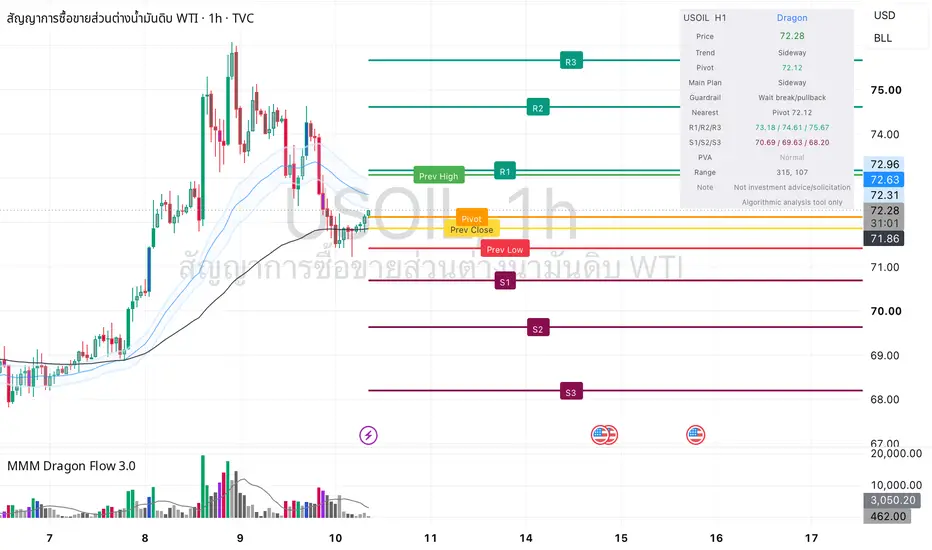
USOIL / WTI Crude Oil CFD 1H Technical Outlook
Date: Friday, July 10, 2026
Instrument: USOIL / WTI Crude Oil CFD
Timeframe: 1H
Current Price Area: 72.24
Market Condition: Sideways / Pivot Decision Zone
WTI Crude Oil is currently trading around the 72.24 area on the 1H timeframe. Price is sitting slightly above the Pivot Point at 72.12, while the trading tool is still classifying the market as Sideways.
The previous move showed strong bullish expansion, but price has since pulled back from the higher range and is now consolidating near the pivot zone. This means the market is not in a clean continuation phase yet. From a CFD trader’s perspective, this is a tactical decision area where confirmation is more important than prediction.
As long as price holds above the pivot, buyers still have a chance to defend the structure and attempt another push toward R1 at 73.18. However, if price fails to hold above 72.12, the market may rotate lower toward the first support zone.
Key Levels
Resistance Levels:
- R1: 73.18
- R2: 74.61
- R3: 75.67
Pivot Point:
- Pivot: 72.12
Support Levels:
- S1: 70.69
- S2: 69.63
- S3: 68.20
Trading Tool Perspective
The trading assistant tool currently shows:
- Trend: Sideways
- Main Plan: Sideways
- Guardrail: Wait break/pullback
- Nearest Key Level: Pivot at 72.12
- PVA Status: Normal
This confirms that the market is currently in a neutral phase. Price is near the pivot, and PVA remains normal, meaning there is no strong volume confirmation for either bullish continuation or bearish breakdown yet.
A sustained break and hold above 73.18 would support a bullish continuation scenario toward R2 at 74.61, with R3 at 75.67 as the next upside reference. If buyers regain momentum above R1, the market structure may shift back into a stronger bullish continuation phase.
On the downside, a clean break below the Pivot Point at 72.12 would weaken the current recovery structure. If that happens, the first downside target to watch is S1 at 70.69. A deeper breakdown below S1 could expose S2 at 69.63 and S3 at 68.20.
The cleaner tactical scenarios are:
1. Bullish continuation scenario:
Price breaks and holds above R1 at 73.18, confirming renewed upside pressure toward R2 and R3.
2. Pullback-buy scenario:
Price pulls back toward the pivot at 72.12, holds above it, and forms a bullish rejection structure.
3. Bearish breakdown scenario:
Price loses the pivot decisively and rotates lower toward S1 at 70.69, weakening the current bullish recovery attempt.
For now, USOIL remains in a sideways decision zone. The pivot is the key level. A confirmed hold above 72.12 keeps the recovery structure alive, while a breakdown below the pivot would shift short-term pressure back toward support.
Risk Warning
This analysis is for educational purposes only and does not constitute financial advice, investment advice, or a trading signal. Trading crude oil CFDs, futures, commodities, forex, and leveraged products involves significant risk and may not be suitable for all traders. Leverage can amplify both profits and losses. Always define your risk before entering a position, use proper position sizing, and trade only according to your own strategy, capital size, and risk tolerance.
Date: Friday, July 10, 2026
Instrument: USOIL / WTI Crude Oil CFD
Timeframe: 1H
Current Price Area: 72.24
Market Condition: Sideways / Pivot Decision Zone
WTI Crude Oil is currently trading around the 72.24 area on the 1H timeframe. Price is sitting slightly above the Pivot Point at 72.12, while the trading tool is still classifying the market as Sideways.
The previous move showed strong bullish expansion, but price has since pulled back from the higher range and is now consolidating near the pivot zone. This means the market is not in a clean continuation phase yet. From a CFD trader’s perspective, this is a tactical decision area where confirmation is more important than prediction.
As long as price holds above the pivot, buyers still have a chance to defend the structure and attempt another push toward R1 at 73.18. However, if price fails to hold above 72.12, the market may rotate lower toward the first support zone.
Key Levels
Resistance Levels:
- R1: 73.18
- R2: 74.61
- R3: 75.67
Pivot Point:
- Pivot: 72.12
Support Levels:
- S1: 70.69
- S2: 69.63
- S3: 68.20
Trading Tool Perspective
The trading assistant tool currently shows:
- Trend: Sideways
- Main Plan: Sideways
- Guardrail: Wait break/pullback
- Nearest Key Level: Pivot at 72.12
- PVA Status: Normal
This confirms that the market is currently in a neutral phase. Price is near the pivot, and PVA remains normal, meaning there is no strong volume confirmation for either bullish continuation or bearish breakdown yet.
A sustained break and hold above 73.18 would support a bullish continuation scenario toward R2 at 74.61, with R3 at 75.67 as the next upside reference. If buyers regain momentum above R1, the market structure may shift back into a stronger bullish continuation phase.
On the downside, a clean break below the Pivot Point at 72.12 would weaken the current recovery structure. If that happens, the first downside target to watch is S1 at 70.69. A deeper breakdown below S1 could expose S2 at 69.63 and S3 at 68.20.
The cleaner tactical scenarios are:
1. Bullish continuation scenario:
Price breaks and holds above R1 at 73.18, confirming renewed upside pressure toward R2 and R3.
2. Pullback-buy scenario:
Price pulls back toward the pivot at 72.12, holds above it, and forms a bullish rejection structure.
3. Bearish breakdown scenario:
Price loses the pivot decisively and rotates lower toward S1 at 70.69, weakening the current bullish recovery attempt.
For now, USOIL remains in a sideways decision zone. The pivot is the key level. A confirmed hold above 72.12 keeps the recovery structure alive, while a breakdown below the pivot would shift short-term pressure back toward support.
Risk Warning
This analysis is for educational purposes only and does not constitute financial advice, investment advice, or a trading signal. Trading crude oil CFDs, futures, commodities, forex, and leveraged products involves significant risk and may not be suitable for all traders. Leverage can amplify both profits and losses. Always define your risk before entering a position, use proper position sizing, and trade only according to your own strategy, capital size, and risk tolerance.

More charts, notes, and trading updates: @mmxmtrading_999 on X
คำจำกัดสิทธิ์ความรับผิดชอบ
ข้อมูลและบทความไม่ได้มีวัตถุประสงค์เพื่อก่อให้เกิดกิจกรรมทางการเงิน, การลงทุน, การซื้อขาย, ข้อเสนอแนะ หรือคำแนะนำประเภทอื่น ๆ ที่ให้หรือรับรองโดย TradingView อ่านเพิ่มเติมใน ข้อกำหนดการใช้งาน
More charts, notes, and trading updates: @mmxmtrading_999 on X
คำจำกัดสิทธิ์ความรับผิดชอบ
ข้อมูลและบทความไม่ได้มีวัตถุประสงค์เพื่อก่อให้เกิดกิจกรรมทางการเงิน, การลงทุน, การซื้อขาย, ข้อเสนอแนะ หรือคำแนะนำประเภทอื่น ๆ ที่ให้หรือรับรองโดย TradingView อ่านเพิ่มเติมใน ข้อกำหนดการใช้งาน