
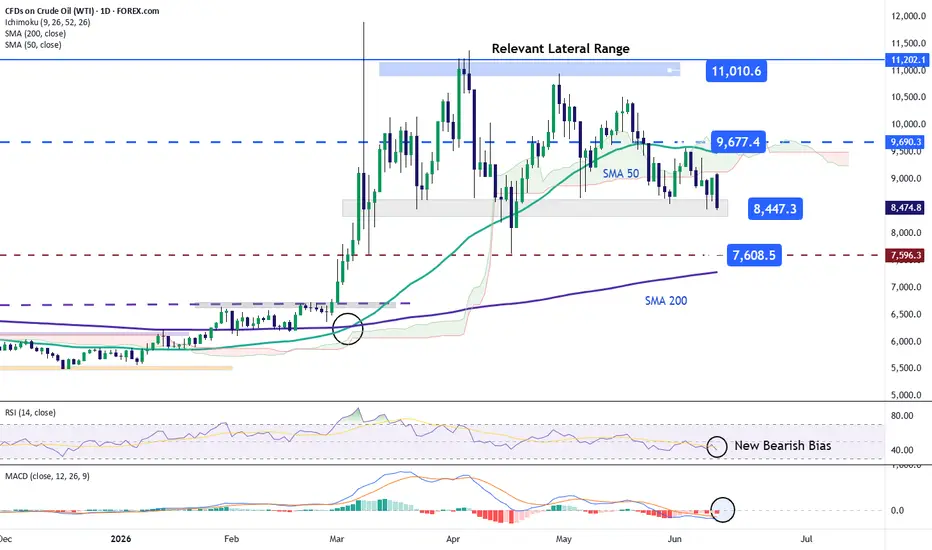
Today’s session was marked by a sharp move lower in WTI crude oil, with the price falling close to -6.00%. The barrel reached levels below the 85-dollar reference area, reflecting relevant short-term selling pressure.
This move came after Trump mentioned the cancellation of planned attacks against Iran overnight and said that talks with the Iranian government are progressing well. This development started to reduce the risk premium in the oil market again and weakened demand in the short term. If positive updates around the Middle East continue, selling pressure could gain further relevance in WTI over the coming sessions.
Price challenges a broad sideways range: Recent weakness in WTI has started to put into question the sideways structure that has remained in place for several weeks, between the upper area near 110 dollars and the lower boundary around 84 dollars per barrel. If the new selling pressure holds consistently in the short term, this sideways range could start to lose relevance and open the door to a clearer dominance of the selling bias over the coming sessions.
RSI: The average movements in RSI are showing slight declines below the 50 area, suggesting that momentum has turned bearish in the short term. If this decline continues in the indicator, it could point to a more relevant selling bias in WTI over the coming sessions.
MACD: The MACD indicator, however, still shows a histogram close to the neutral 0 line. As long as the histogram fails to move clearly away from this level, it will continue to reflect a certain balance in the strength of short-term moving averages. This could suggest that a possible phase of indecision has not fully disappeared from the chart and may still remain relevant.
Key levels to watch:
96 dollars: This is the most relevant resistance area on the chart and coincides with the barrier marked by the 50-period moving average. Price movements back toward this level could highlight a dominant phase of indecision and extend the importance of the broad sideways range seen over the last few trading weeks.
84 dollars: Nearby support that corresponds to the lower area of the current broad sideways range. Price action below this level would start to invalidate that range and could open the door to a dominant selling bias over the coming sessions.
76 dollars: Definitive support barrier that corresponds to the recent low area and is close to the 200-period moving average. Consistent moves toward this zone would mark the beginning of stronger selling pressure and could start to form a possible bearish trendline over the coming weeks.
Written by Julian Pineda, CFA, CMT – Market Analyst
This move came after Trump mentioned the cancellation of planned attacks against Iran overnight and said that talks with the Iranian government are progressing well. This development started to reduce the risk premium in the oil market again and weakened demand in the short term. If positive updates around the Middle East continue, selling pressure could gain further relevance in WTI over the coming sessions.
Price challenges a broad sideways range: Recent weakness in WTI has started to put into question the sideways structure that has remained in place for several weeks, between the upper area near 110 dollars and the lower boundary around 84 dollars per barrel. If the new selling pressure holds consistently in the short term, this sideways range could start to lose relevance and open the door to a clearer dominance of the selling bias over the coming sessions.
RSI: The average movements in RSI are showing slight declines below the 50 area, suggesting that momentum has turned bearish in the short term. If this decline continues in the indicator, it could point to a more relevant selling bias in WTI over the coming sessions.
MACD: The MACD indicator, however, still shows a histogram close to the neutral 0 line. As long as the histogram fails to move clearly away from this level, it will continue to reflect a certain balance in the strength of short-term moving averages. This could suggest that a possible phase of indecision has not fully disappeared from the chart and may still remain relevant.
Key levels to watch:
96 dollars: This is the most relevant resistance area on the chart and coincides with the barrier marked by the 50-period moving average. Price movements back toward this level could highlight a dominant phase of indecision and extend the importance of the broad sideways range seen over the last few trading weeks.
84 dollars: Nearby support that corresponds to the lower area of the current broad sideways range. Price action below this level would start to invalidate that range and could open the door to a dominant selling bias over the coming sessions.
76 dollars: Definitive support barrier that corresponds to the recent low area and is close to the 200-period moving average. Consistent moves toward this zone would mark the beginning of stronger selling pressure and could start to form a possible bearish trendline over the coming weeks.
Written by Julian Pineda, CFA, CMT – Market Analyst

คำจำกัดสิทธิ์ความรับผิดชอบ
ข้อมูลและบทความไม่ได้มีวัตถุประสงค์เพื่อก่อให้เกิดกิจกรรมทางการเงิน, การลงทุน, การซื้อขาย, ข้อเสนอแนะ หรือคำแนะนำประเภทอื่น ๆ ที่ให้หรือรับรองโดย TradingView อ่านเพิ่มเติมใน ข้อกำหนดการใช้งาน
คำจำกัดสิทธิ์ความรับผิดชอบ
ข้อมูลและบทความไม่ได้มีวัตถุประสงค์เพื่อก่อให้เกิดกิจกรรมทางการเงิน, การลงทุน, การซื้อขาย, ข้อเสนอแนะ หรือคำแนะนำประเภทอื่น ๆ ที่ให้หรือรับรองโดย TradingView อ่านเพิ่มเติมใน ข้อกำหนดการใช้งาน