Remember, stop-loss is not a loss—it's sensible risk management. Holding on to losing positions? That's a shortcut to ruin. Discipline is your trading armor; emotions are the fuse that ignites catastrophic losses. Stick to your plan, guys.
Key driving factors: 1. Geopolitical conflicts dominate the supply side: the US strikes Iran's oil export hub, shipping in the Strait of Hormuz is almost at a standstill, and Middle Eastern oil-producing countries are forced to reduce production, with an average daily supply disruption of 5.3-5.4 million barrels, pushing up the supply risk premium; 2. Policy intervention to offset the rise: the IEA and G7 plan to release 400 million barrels of strategic petroleum reserves, which will alleviate the supply-demand gap in the short term, but the delivery cycle is long, so the suppression of the current market is limited; 3. Technically, the bulls still dominate, but indicators at high levels show increasing pressure for a short-term correction.
On the 4-hour chart, oil prices are trading above the 20-day, 50-day, and 100-day moving averages, which are in a bullish alignment, indicating a short-term bullish trend. However, the narrowing gap between the moving averages suggests a need for consolidation.
Momentum indicators: The RSI indicator remains above 60, indicating that buying power still dominates, but it has not broken through the overbought zone of 70, suggesting a possible pullback for consolidation.
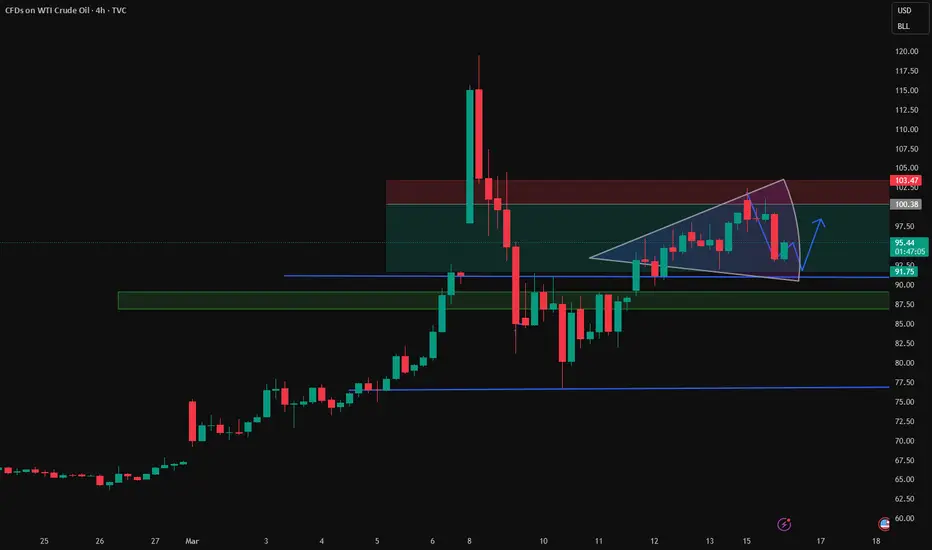
Technical Analysis: The market has recently experienced a rollercoaster ride of volatility. After a surge in early March, it quickly corrected and is currently in a consolidation phase at high levels. No clear breakout or breakdown pattern has yet emerged, and the divergence between bulls and bears is intensifying.
Support levels: $90.0-$92.0
Resistance levels: $102.4-$102.5
Technically, the market is consolidating at high levels with significant divergence between bulls and bears. Avoid full-position trading.
 USOIL USOIL USOILUSDT.P $TRADU:USOIL USOIL
Key driving factors: 1. Geopolitical conflicts dominate the supply side: the US strikes Iran's oil export hub, shipping in the Strait of Hormuz is almost at a standstill, and Middle Eastern oil-producing countries are forced to reduce production, with an average daily supply disruption of 5.3-5.4 million barrels, pushing up the supply risk premium; 2. Policy intervention to offset the rise: the IEA and G7 plan to release 400 million barrels of strategic petroleum reserves, which will alleviate the supply-demand gap in the short term, but the delivery cycle is long, so the suppression of the current market is limited; 3. Technically, the bulls still dominate, but indicators at high levels show increasing pressure for a short-term correction.
On the 4-hour chart, oil prices are trading above the 20-day, 50-day, and 100-day moving averages, which are in a bullish alignment, indicating a short-term bullish trend. However, the narrowing gap between the moving averages suggests a need for consolidation.
Momentum indicators: The RSI indicator remains above 60, indicating that buying power still dominates, but it has not broken through the overbought zone of 70, suggesting a possible pullback for consolidation.
Technical Analysis: The market has recently experienced a rollercoaster ride of volatility. After a surge in early March, it quickly corrected and is currently in a consolidation phase at high levels. No clear breakout or breakdown pattern has yet emerged, and the divergence between bulls and bears is intensifying.
Support levels: $90.0-$92.0
Resistance levels: $102.4-$102.5
Technically, the market is consolidating at high levels with significant divergence between bulls and bears. Avoid full-position trading.
USOIL USOIL USOILUSDT.P $TRADU:USOIL USOIL 
คำจำกัดสิทธิ์ความรับผิดชอบ
ข้อมูลและบทความไม่ได้มีวัตถุประสงค์เพื่อก่อให้เกิดกิจกรรมทางการเงิน, การลงทุน, การซื้อขาย, ข้อเสนอแนะ หรือคำแนะนำประเภทอื่น ๆ ที่ให้หรือรับรองโดย TradingView อ่านเพิ่มเติมใน ข้อกำหนดการใช้งาน
คำจำกัดสิทธิ์ความรับผิดชอบ
ข้อมูลและบทความไม่ได้มีวัตถุประสงค์เพื่อก่อให้เกิดกิจกรรมทางการเงิน, การลงทุน, การซื้อขาย, ข้อเสนอแนะ หรือคำแนะนำประเภทอื่น ๆ ที่ให้หรือรับรองโดย TradingView อ่านเพิ่มเติมใน ข้อกำหนดการใช้งาน