
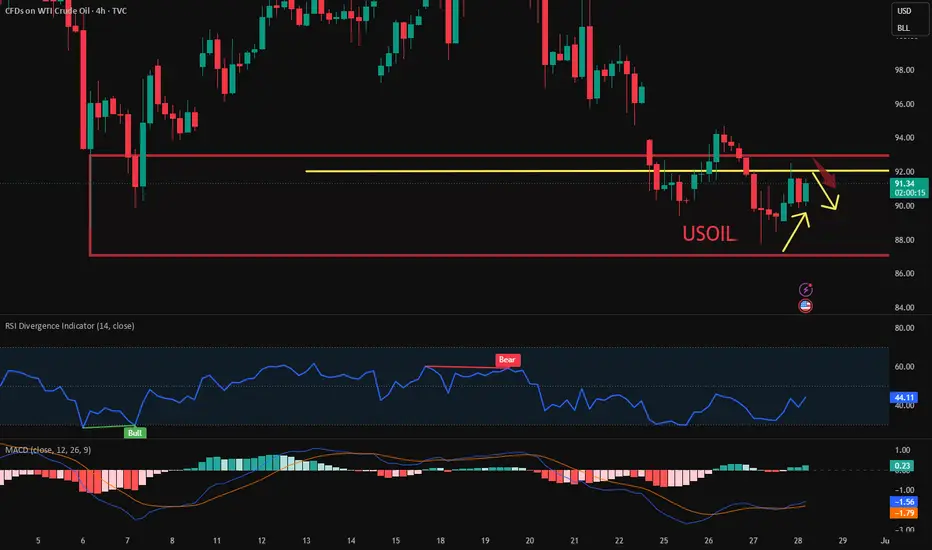
Oil prices have fallen below the 50-day moving average, the MACD death cross has been followed by a continuous expansion of the green bars, and the KDJ lines are opening downwards, indicating an overall bearish trend on the daily chart. However, signs of stabilization have emerged around $88, and the RSI indicator is approaching oversold territory, suggesting a short-term technical need for a rebound from oversold conditions.
4-hour chart: The MACD shows a bullish divergence signal, providing some technical evidence for a short-term rebound. The current resistance level is located in the $91.71-$92.4 area, which is a key dividing line between short-term bullish and bearish trends.
1-hour chart: The trend is showing the beginnings of a flag pattern, with the moving average system in a bearish alignment, indicating significant downward pressure and continued dominance of bearish momentum.
Short positions can be entered around $92.
4-hour chart: The MACD shows a bullish divergence signal, providing some technical evidence for a short-term rebound. The current resistance level is located in the $91.71-$92.4 area, which is a key dividing line between short-term bullish and bearish trends.
1-hour chart: The trend is showing the beginnings of a flag pattern, with the moving average system in a bearish alignment, indicating significant downward pressure and continued dominance of bearish momentum.
Short positions can be entered around $92.

คำจำกัดสิทธิ์ความรับผิดชอบ
ข้อมูลและบทความไม่ได้มีวัตถุประสงค์เพื่อก่อให้เกิดกิจกรรมทางการเงิน, การลงทุน, การซื้อขาย, ข้อเสนอแนะ หรือคำแนะนำประเภทอื่น ๆ ที่ให้หรือรับรองโดย TradingView อ่านเพิ่มเติมใน ข้อกำหนดการใช้งาน
คำจำกัดสิทธิ์ความรับผิดชอบ
ข้อมูลและบทความไม่ได้มีวัตถุประสงค์เพื่อก่อให้เกิดกิจกรรมทางการเงิน, การลงทุน, การซื้อขาย, ข้อเสนอแนะ หรือคำแนะนำประเภทอื่น ๆ ที่ให้หรือรับรองโดย TradingView อ่านเพิ่มเติมใน ข้อกำหนดการใช้งาน