
Ask ten traders how they identify potential reversal zones, and chances are several of them will mention the Fibonacci Retracement tool.
Whether they trade stocks, forex, cryptocurrencies, or commodities, Fibonacci levels appear on charts across every financial market.
This naturally raises an interesting question.
Why do Fibonacci levels seem to work?
Is there something magical about the numbers?
Or is something else happening beneath the surface?
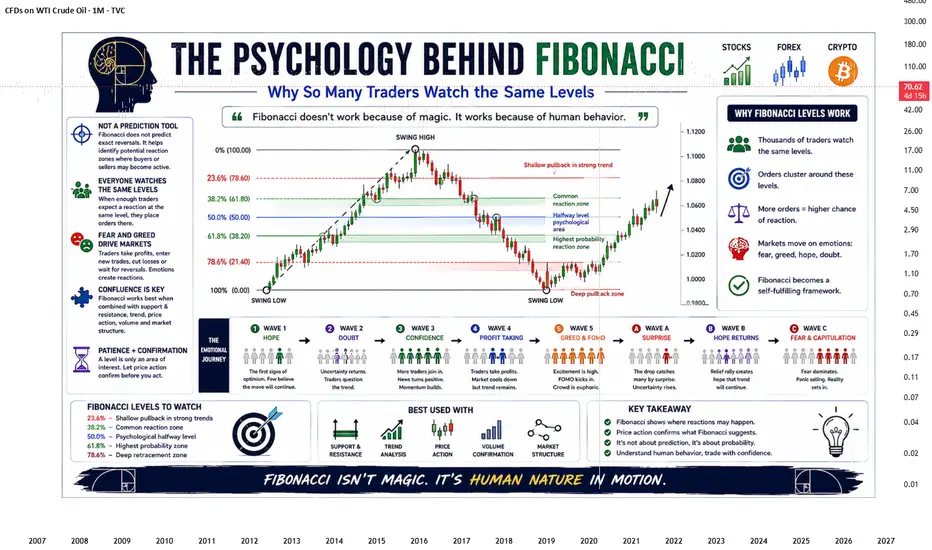
The truth is that Fibonacci is less about mathematics and more about human behavior.
Markets don't react because of the tool itself. They react because thousands of traders around the world are watching the same levels and making decisions based on them.
Fibonacci Is a Framework, Not a Prediction
Many beginners believe Fibonacci can predict exactly where price will reverse.
It can't.
Instead, Fibonacci helps traders identify areas where buyers and sellers may become active.
Levels such as 38.2%, 50%, and 61.8% are not guarantees.
They are simply zones where market participants often pause, take profits, or look for new opportunities.
Thinking of Fibonacci as a decision-making framework rather than a prediction tool changes the way you use it.
Why Everyone Watches the Same Levels
Financial markets are driven by expectations.
When enough traders expect price to react near a particular level, many of them place orders around that area.
Some traders look for buying opportunities.
Others take profits.
Some reduce risk, while others prepare for reversals.
As more orders gather around the same price zone, the probability of a reaction naturally increases.
In many ways, Fibonacci becomes a self-fulfilling concept.
It works not because markets obey mathematics, but because traders collectively pay attention to it.
The Role of Fear and Greed
Imagine a strong bullish trend.
Price begins pulling back.
Some traders become nervous and close profitable positions.
Others patiently wait for a retracement before buying.
When price reaches a commonly watched Fibonacci level, both groups become active.
One side is taking profits.
The other is entering new trades.
This interaction between fear and opportunity often creates the reactions traders observe on their charts.
The same emotional process occurs during bearish markets.
Fibonacci Works Best with Market Context
One of the biggest mistakes traders make is drawing Fibonacci on every price swing they see.
Without context, the tool loses much of its value.
Experienced traders rarely use Fibonacci in isolation.
Instead, they combine it with:
* Support and resistance
* Trend analysis
* Market structure
* Candlestick confirmation
* Volume
* Price action
When multiple factors point to the same area, confidence in the setup naturally increases.
This is known as confluence.
The Importance of Patience
Another common misconception is that price must reverse the moment it touches a Fibonacci level.
Markets are rarely that precise.
Sometimes price reacts immediately.
Other times it moves slightly beyond the level before reversing.
This is why patient traders wait for confirmation instead of blindly placing trades.
The Fibonacci level identifies an area of interest.
Price action confirms whether buyers or sellers are actually taking control.
Fibonacci Reflects Crowd Behavior
Perhaps the greatest strength of Fibonacci is not the numbers themselves.
It is what those numbers represent.
They reveal where traders are likely to become interested.
Where profits may be taken.
Where emotions begin to change.
And where the balance between buyers and sellers may temporarily shift.
Understanding this psychological perspective helps traders avoid treating Fibonacci as a magical indicator.
Instead, it becomes a tool for understanding market behavior.
Final words:
Fibonacci is not a secret formula for predicting the future.
It is a way of identifying areas where human decisions are most likely to influence price.
The levels themselves are only part of the story.
The real story is the psychology behind them.
Because every retracement, every bounce, and every reversal begins with traders making decisions.
And in the financial markets, understanding people is often more valuable than memorizing numbers.
Whether they trade stocks, forex, cryptocurrencies, or commodities, Fibonacci levels appear on charts across every financial market.
This naturally raises an interesting question.
Why do Fibonacci levels seem to work?
Is there something magical about the numbers?
Or is something else happening beneath the surface?
The truth is that Fibonacci is less about mathematics and more about human behavior.
Markets don't react because of the tool itself. They react because thousands of traders around the world are watching the same levels and making decisions based on them.
Fibonacci Is a Framework, Not a Prediction
Many beginners believe Fibonacci can predict exactly where price will reverse.
It can't.
Instead, Fibonacci helps traders identify areas where buyers and sellers may become active.
Levels such as 38.2%, 50%, and 61.8% are not guarantees.
They are simply zones where market participants often pause, take profits, or look for new opportunities.
Thinking of Fibonacci as a decision-making framework rather than a prediction tool changes the way you use it.
Why Everyone Watches the Same Levels
Financial markets are driven by expectations.
When enough traders expect price to react near a particular level, many of them place orders around that area.
Some traders look for buying opportunities.
Others take profits.
Some reduce risk, while others prepare for reversals.
As more orders gather around the same price zone, the probability of a reaction naturally increases.
In many ways, Fibonacci becomes a self-fulfilling concept.
It works not because markets obey mathematics, but because traders collectively pay attention to it.
The Role of Fear and Greed
Imagine a strong bullish trend.
Price begins pulling back.
Some traders become nervous and close profitable positions.
Others patiently wait for a retracement before buying.
When price reaches a commonly watched Fibonacci level, both groups become active.
One side is taking profits.
The other is entering new trades.
This interaction between fear and opportunity often creates the reactions traders observe on their charts.
The same emotional process occurs during bearish markets.
Fibonacci Works Best with Market Context
One of the biggest mistakes traders make is drawing Fibonacci on every price swing they see.
Without context, the tool loses much of its value.
Experienced traders rarely use Fibonacci in isolation.
Instead, they combine it with:
* Support and resistance
* Trend analysis
* Market structure
* Candlestick confirmation
* Volume
* Price action
When multiple factors point to the same area, confidence in the setup naturally increases.
This is known as confluence.
The Importance of Patience
Another common misconception is that price must reverse the moment it touches a Fibonacci level.
Markets are rarely that precise.
Sometimes price reacts immediately.
Other times it moves slightly beyond the level before reversing.
This is why patient traders wait for confirmation instead of blindly placing trades.
The Fibonacci level identifies an area of interest.
Price action confirms whether buyers or sellers are actually taking control.
Fibonacci Reflects Crowd Behavior
Perhaps the greatest strength of Fibonacci is not the numbers themselves.
It is what those numbers represent.
They reveal where traders are likely to become interested.
Where profits may be taken.
Where emotions begin to change.
And where the balance between buyers and sellers may temporarily shift.
Understanding this psychological perspective helps traders avoid treating Fibonacci as a magical indicator.
Instead, it becomes a tool for understanding market behavior.
Final words:
Fibonacci is not a secret formula for predicting the future.
It is a way of identifying areas where human decisions are most likely to influence price.
The levels themselves are only part of the story.
The real story is the psychology behind them.
Because every retracement, every bounce, and every reversal begins with traders making decisions.
And in the financial markets, understanding people is often more valuable than memorizing numbers.

คำจำกัดสิทธิ์ความรับผิดชอบ
ข้อมูลและบทความไม่ได้มีวัตถุประสงค์เพื่อก่อให้เกิดกิจกรรมทางการเงิน, การลงทุน, การซื้อขาย, ข้อเสนอแนะ หรือคำแนะนำประเภทอื่น ๆ ที่ให้หรือรับรองโดย TradingView อ่านเพิ่มเติมใน ข้อกำหนดการใช้งาน
คำจำกัดสิทธิ์ความรับผิดชอบ
ข้อมูลและบทความไม่ได้มีวัตถุประสงค์เพื่อก่อให้เกิดกิจกรรมทางการเงิน, การลงทุน, การซื้อขาย, ข้อเสนอแนะ หรือคำแนะนำประเภทอื่น ๆ ที่ให้หรือรับรองโดย TradingView อ่านเพิ่มเติมใน ข้อกำหนดการใช้งาน