
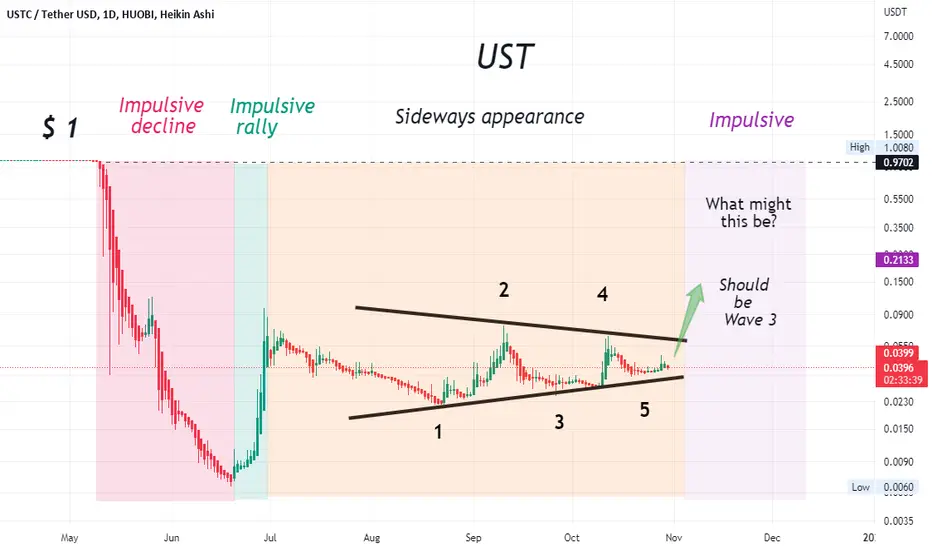
As shown on this chart (consists of three distinct sections),
1-Impulsive decline = supply > demand,
2-Impulsive rally = demand > supply,
3- Sideways appearance = supply and demand are nearly equal.
What to expect next?
At this point, low volatility and low volume indicate a drying up of selling pressure.
Target
Point and Figure Configuration:

1-Impulsive decline = supply > demand,
2-Impulsive rally = demand > supply,
3- Sideways appearance = supply and demand are nearly equal.
What to expect next?
At this point, low volatility and low volume indicate a drying up of selling pressure.
Target
Point and Figure Configuration:
บันทึก
บันทึก
บันทึก
บันทึก
บันทึก
บันทึก
บันทึก

คำจำกัดสิทธิ์ความรับผิดชอบ
ข้อมูลและบทความไม่ได้มีวัตถุประสงค์เพื่อก่อให้เกิดกิจกรรมทางการเงิน, การลงทุน, การซื้อขาย, ข้อเสนอแนะ หรือคำแนะนำประเภทอื่น ๆ ที่ให้หรือรับรองโดย TradingView อ่านเพิ่มเติมใน ข้อกำหนดการใช้งาน
คำจำกัดสิทธิ์ความรับผิดชอบ
ข้อมูลและบทความไม่ได้มีวัตถุประสงค์เพื่อก่อให้เกิดกิจกรรมทางการเงิน, การลงทุน, การซื้อขาย, ข้อเสนอแนะ หรือคำแนะนำประเภทอื่น ๆ ที่ให้หรือรับรองโดย TradingView อ่านเพิ่มเติมใน ข้อกำหนดการใช้งาน