
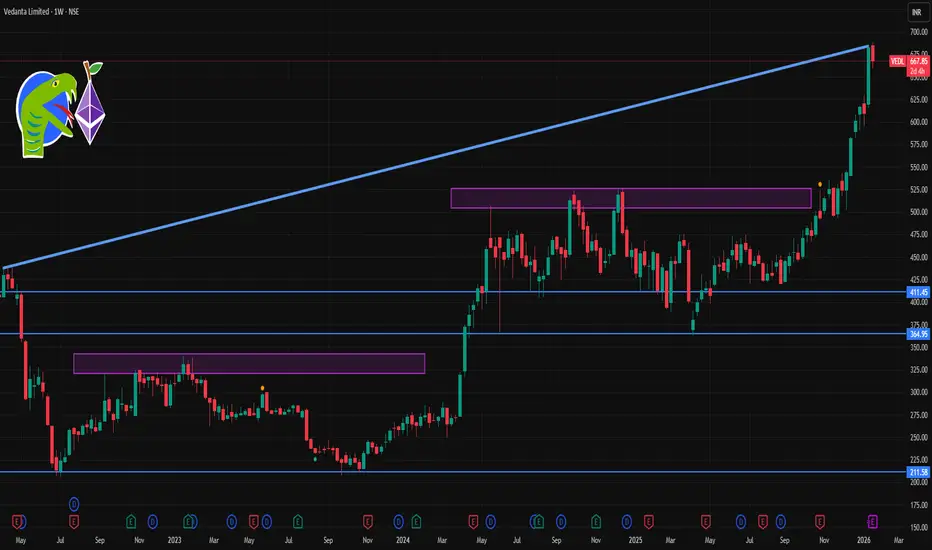
📊 Current Price Context (approximate latest)
• Vedanta is trading around ₹660‑₹675 range on NSE as of the latest session.
📈 Weekly Resistance Levels
These are levels where the stock might face selling pressure on an upward move:
Resistance Zones
1. ₹682–₹688 area – near recent intraday highs and 52‑week high cluster.
2. ~₹693–₹700 – broader higher resistance in week ahead.
3. Above ₹700 – extended breakout zone if bullish momentum accelerates.
👉 Bullish breakout triggers shorter‑term targets toward these zones, especially if sustained above daily pivots/resistance.
📉 Weekly Support Levels
These are areas where price might find buyers or pullback cushions:
Support Zones
1. ~₹665–₹658 – immediate weekly support cluster.
2. ~₹647–₹648 – next meaningful support if the price weakens.
3. ~₹620–₹630 – deeper pivot/demand zone from recent action (from broader short‑term analysis).
4. ~₹560–₹570 – more distant support if the stock corrects further from current levels.
👉 A break below ₹658–665 on weekly closes could shift bias toward deeper support ranges.
🔁 1‑Week Bias Summary
Scenario Level to Watch What It Implies
Bullish continuation Above ₹682–₹688 Can target ₹693–₹700+
Neutral / congestion ₹665–₹658 Choppy range, sideways trades
Bearish correction Below ₹658 Deeper support at ₹620–₹570+

Contact Knowledgehub for a detailed consultation: Dm on WhatsApp: [wa.link/a2o0kz]-
Phone No: [+91 93102 26243]-
Email: [tradingviewknowledgehub@gmail.com]---
-- Let’s achieve success together!
Phone No: [+91 93102 26243]-
Email: [tradingviewknowledgehub@gmail.com]---
-- Let’s achieve success together!
การนำเสนอที่เกี่ยวข้อง
คำจำกัดสิทธิ์ความรับผิดชอบ
ข้อมูลและบทความไม่ได้มีวัตถุประสงค์เพื่อก่อให้เกิดกิจกรรมทางการเงิน, การลงทุน, การซื้อขาย, ข้อเสนอแนะ หรือคำแนะนำประเภทอื่น ๆ ที่ให้หรือรับรองโดย TradingView อ่านเพิ่มเติมใน ข้อกำหนดการใช้งาน