
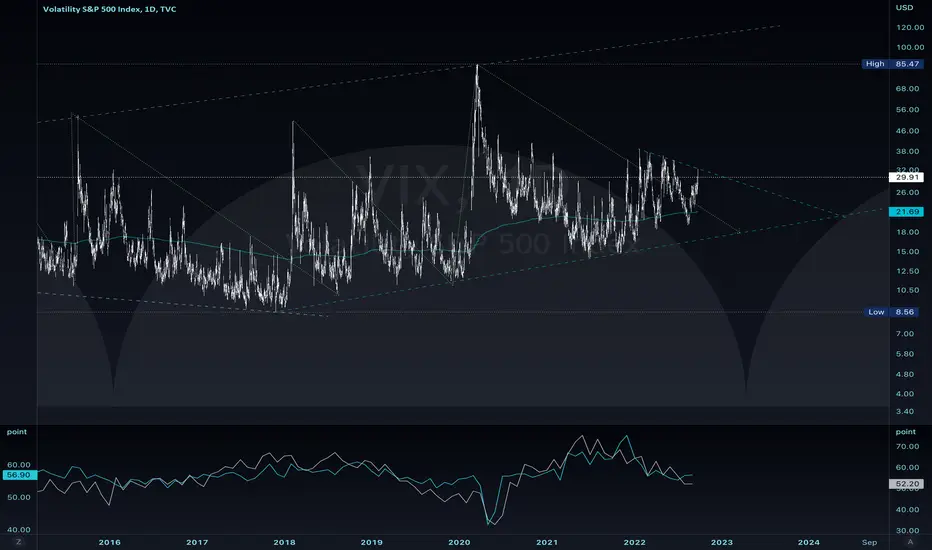
A macro view of VIX versus US Manufacturing and Non-Manufacturing PMI's with a visual aid for base time cycles.
Taking note without special emphasis of the 200 Week EMA of the VIX, which may be utilized as a confirming indicator a period of continued elevated volatility.
Chart is intended as a simple visual aid for contraction and expansion periods in the US economy.
Taking note without special emphasis of the 200 Week EMA of the VIX, which may be utilized as a confirming indicator a period of continued elevated volatility.
Chart is intended as a simple visual aid for contraction and expansion periods in the US economy.

คำจำกัดสิทธิ์ความรับผิดชอบ
ข้อมูลและบทความไม่ได้มีวัตถุประสงค์เพื่อก่อให้เกิดกิจกรรมทางการเงิน, การลงทุน, การซื้อขาย, ข้อเสนอแนะ หรือคำแนะนำประเภทอื่น ๆ ที่ให้หรือรับรองโดย TradingView อ่านเพิ่มเติมใน ข้อกำหนดการใช้งาน
คำจำกัดสิทธิ์ความรับผิดชอบ
ข้อมูลและบทความไม่ได้มีวัตถุประสงค์เพื่อก่อให้เกิดกิจกรรมทางการเงิน, การลงทุน, การซื้อขาย, ข้อเสนอแนะ หรือคำแนะนำประเภทอื่น ๆ ที่ให้หรือรับรองโดย TradingView อ่านเพิ่มเติมใน ข้อกำหนดการใช้งาน