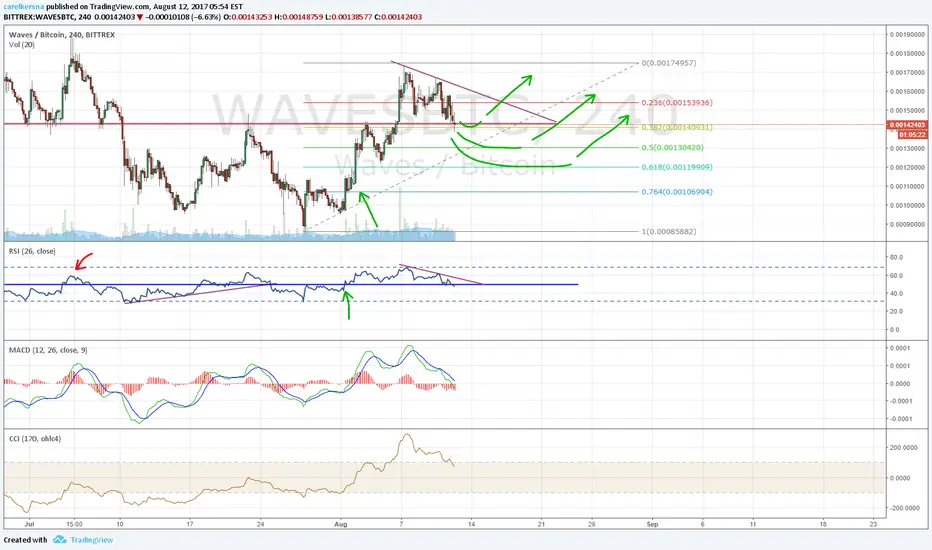
3 levels to watch.
Blue line also represents the 50 line on RSI. Expecting volatility around that level, because every time price makes a great move, RSI breaks below or above 50 level.
So as long as RSI stays above 50, its either movement to the upside or worst case sideways movement.
Blue line also represents the 50 line on RSI. Expecting volatility around that level, because every time price makes a great move, RSI breaks below or above 50 level.
So as long as RSI stays above 50, its either movement to the upside or worst case sideways movement.

คำจำกัดสิทธิ์ความรับผิดชอบ
ข้อมูลและบทความไม่ได้มีวัตถุประสงค์เพื่อก่อให้เกิดกิจกรรมทางการเงิน, การลงทุน, การซื้อขาย, ข้อเสนอแนะ หรือคำแนะนำประเภทอื่น ๆ ที่ให้หรือรับรองโดย TradingView อ่านเพิ่มเติมใน ข้อกำหนดการใช้งาน
คำจำกัดสิทธิ์ความรับผิดชอบ
ข้อมูลและบทความไม่ได้มีวัตถุประสงค์เพื่อก่อให้เกิดกิจกรรมทางการเงิน, การลงทุน, การซื้อขาย, ข้อเสนอแนะ หรือคำแนะนำประเภทอื่น ๆ ที่ให้หรือรับรองโดย TradingView อ่านเพิ่มเติมใน ข้อกำหนดการใช้งาน